شراء العملات المشفرة
بطاقة
تداول P2P
اشتر USDT عبر السوق
بطاقة الائتمان/الخصم
اشترِ العملات المشفرة باستخدام Visa أو Mastercard
الدفع من جهة خارجية
اشترِ العملات المشفرة عبر MoonPay و Simplex والمزيد
بطاقة بيتمارت
تعزيز قدرات حياتك في مجال العملات المشفرة
بطاقة مسبقة الدفع للعملات المشفرة
احصل على بطاقة ماستركارد صالحة للاستخدام فورًا
Rewards
السحب اليومي للحسابات الآجلة
فرصة ربح مضمونة بنسبة 100% مع التداولات اليومية
السحب اليومي لحساب فوري
اكسب 8888 USDT في الجوائز الكبرى
شحن رصيد الهاتف المحمول
شحن الرصيد بسهولة، عبر الإنترنت، وبأمان
Send
Send money globally, fast and secure
BitMart Mall
بث مباشر للعملات المشفرة

Amp بيانات الأسعار المباشرة
سعر اليوم لـ Amp هو $ 0.00052 (AMP/USD). بقيمة سوقية تبلغ $ 45.24M USD. حجم التداول خلال 24 ساعة لـ $ 100.33K USD، تغير السعر خلال 24 ساعة بمقدار -0.57%، وإمداد متداول قدره 86.78B AMP.
Amp AMP سجل الأسعار USD
تتبع سعر Amp لليوم، و7 أيام، و30 يومًا، و90 يومًا
الفترة
تغير
التغير (%)
اليوم
$ 0.0000029
-0.57%
7أيام
$ 0.0000039
-0.76%
30أيام
$ 0.00031
-37.49%
90أيام
$ 0.00066
-56.21%
امتلك AMP الآن
اشترِ وبع AMP بسهولة وأمان على BitMart.
Amp معلومات السوق
$ 0.00051 مدى 24سا $ 0.00052
أعلى مستوى على الإطلاق
$ 0.022
أدنى مستوى على الإطلاق
$ 0.00049
تغير24سا
-0.57%
حجم 24سا
$ 100,334.34
الإمداد المتداول
86.78B
AMP
القيمة السوقية
$ 45.24M
الحد الأقصى للإمداد
100.00B
AMP
القيمة السوقية المخففة بالكامل
$ 52.14M
التداول AMP

Amp رؤى X

Jeremy Allaire - jerallaire.arc
Founder
Influencer
B
 181.0K @jerallaire
 صاعد
AMP is exploring transaction fairness and PFOF rebate functionality, still pending validation.

Gordon Liao D
9.5K @gordonliao AMP enables transaction fairness, PFOF rebates, and much more. Talk to us if you are interested in exploring serving as a proposer with App-Specific Sequencing and unique order flows.
Note: AMP is exploratory research at this stage until further validation.
 100
100
 10
10
 14.9K
14.9K
2026-06-12 08:27
اتجاه AMP بعد الإصدار
صاعد
AMP is exploring transaction fairness and PFOF rebate functionality, still pending validation.

CJ Bennett
TA_Analyst
Educator
B
3.5K @the_real_CJ محايد
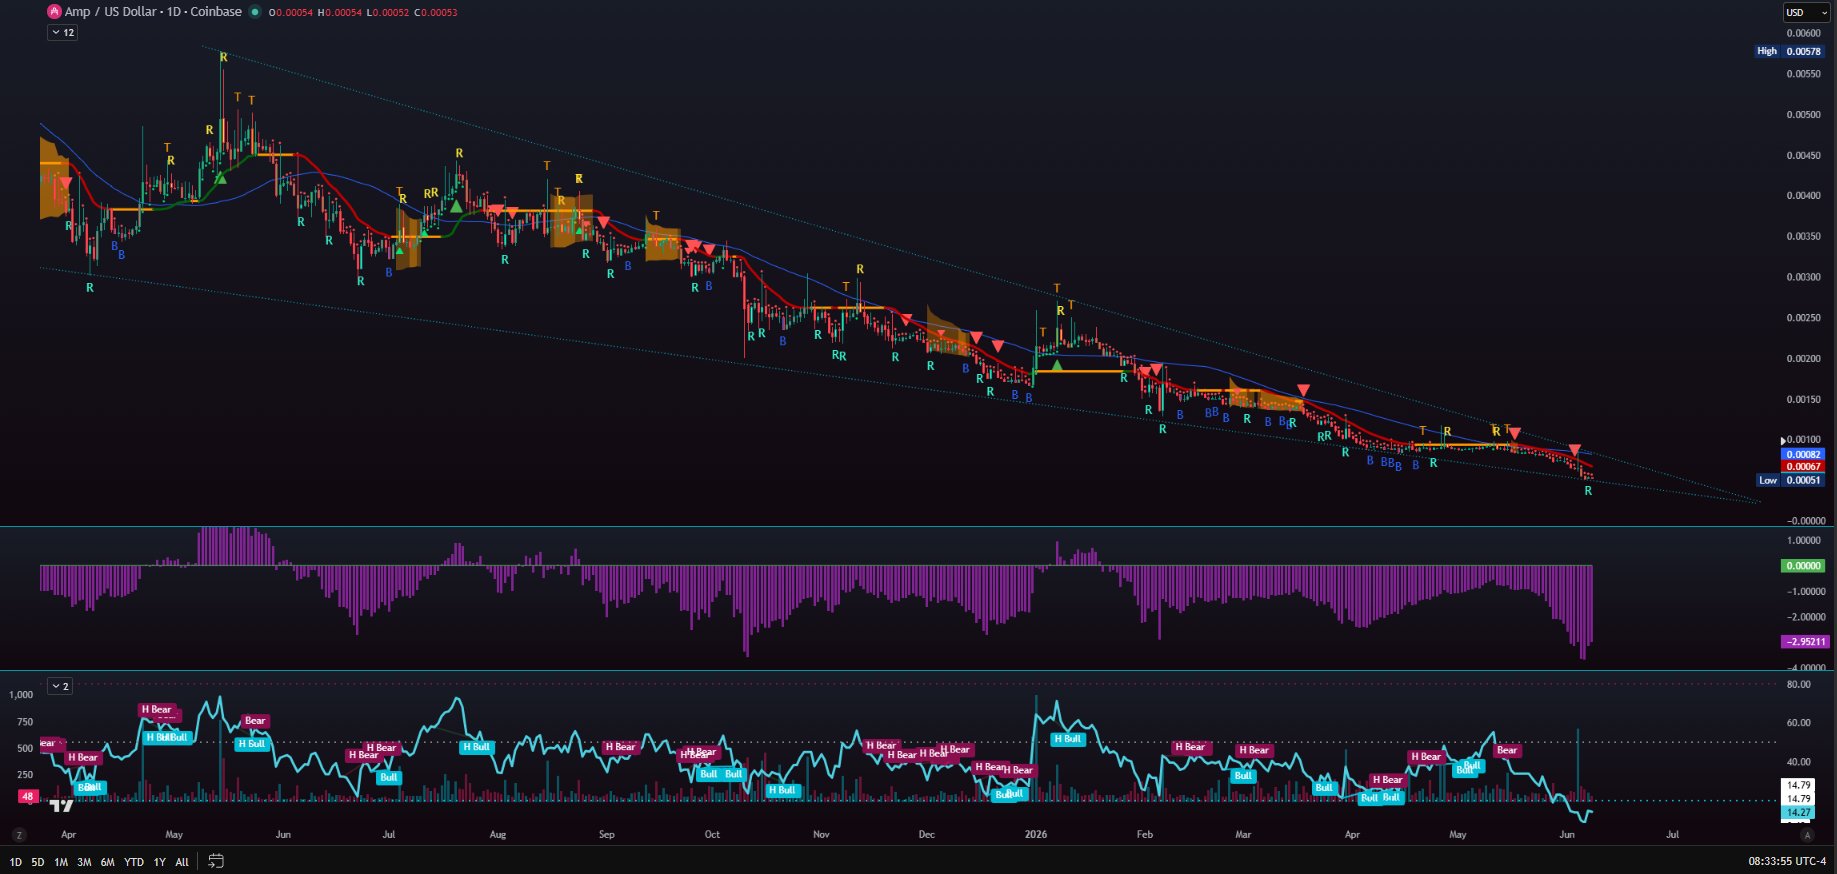
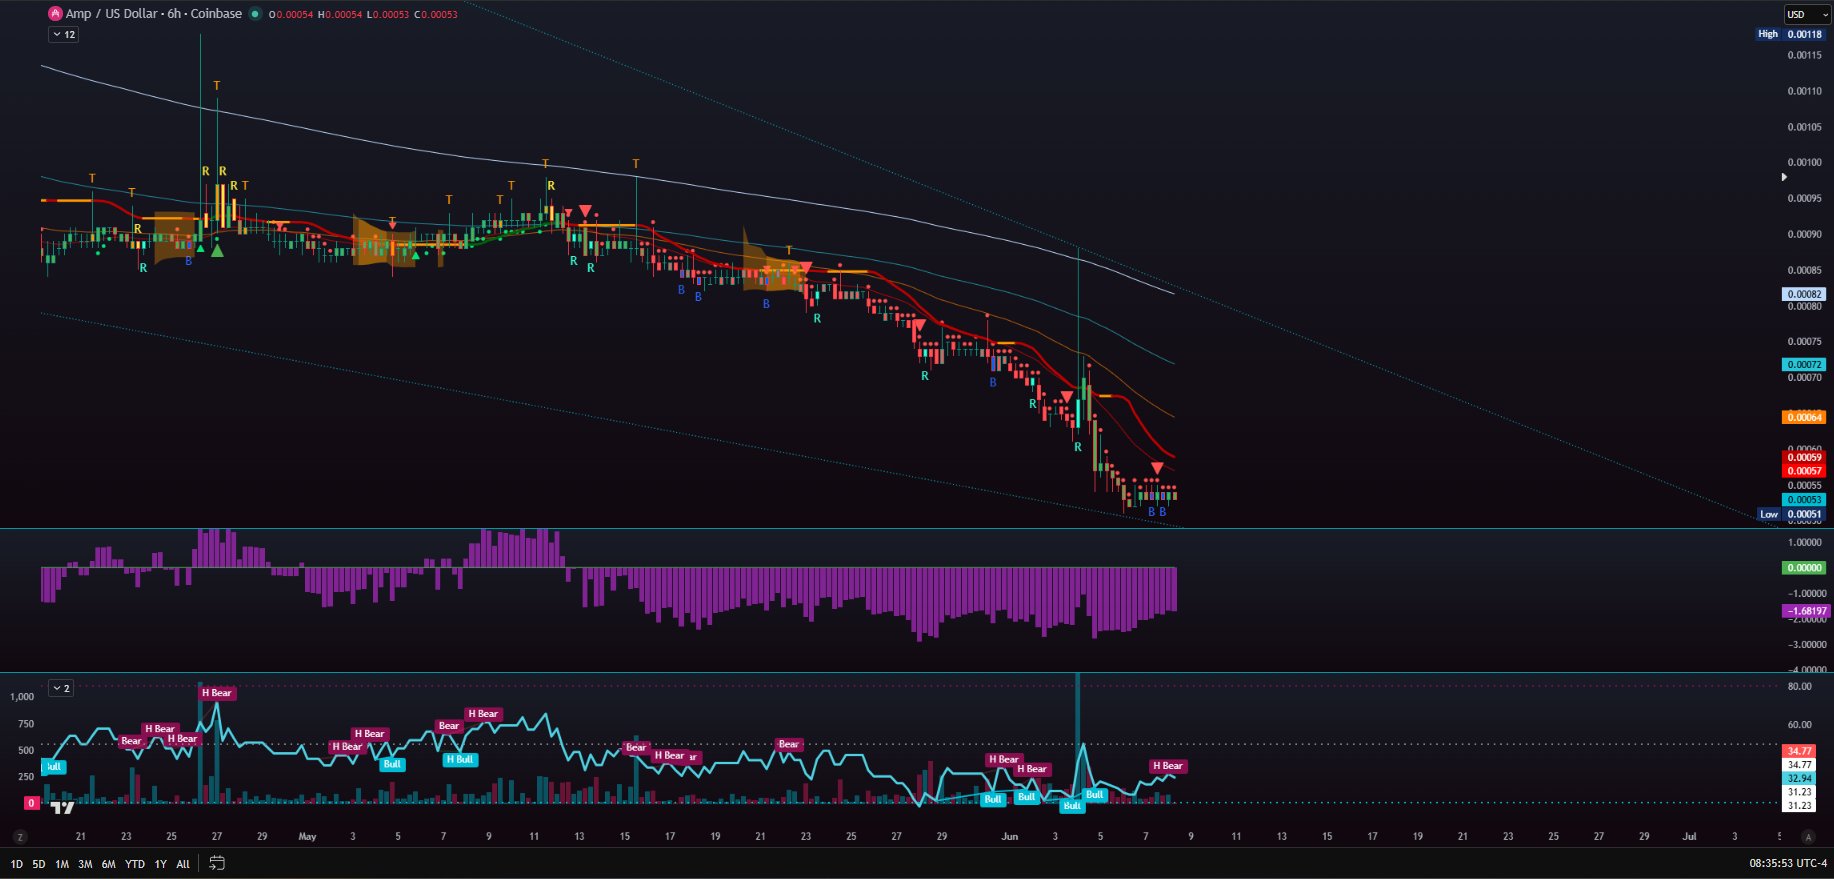
AMP has been in a long-term descending wedge pattern, with RSI severely oversold, and we need to watch whether it can break out and form a new trend before the end of July.
$amp
Still the same setup as the last few years: smaller structure inside a larger structure. The key areas to watch for above and below are still the same.
As time goes on, however, this smaller wedge will need to break inside the larger one. By the end of July, this smaller structure will have to break and create a new trend. The RSI has been horrendous and way oversold, but capitulation is what happens when you hit peak bear market levels. All in all, we just have to continue watching the above and below breaking points. This smaller wedge has been here since last January 2025.
 43
5
1.7K
43
5
1.7K
2026-06-08 12:57
اتجاه AMP بعد الإصدار
محايد
AMP has been in a long-term descending wedge pattern, with RSI severely oversold, and we need to watch whether it can break out and form a new trend before the end of July.

Crypto Tolga
TA_Analyst
Trader
B
79.1K @CryptoTolga_ صاعد
AMP chart shows a breakout above resistance, indicating significant upside potential.
0
0
0
2026-06-07 05:18
اتجاه AMP بعد الإصدار
صاعد
AMP chart shows a breakout above resistance, indicating significant upside potential.
توقع السعر
متى يكون الوقت المناسب لشراء AMP؟ هل يجب أن أشتري AMP أو أبيعه الآن؟
عند اتخاذ قرار ما إذا كان الوقت مناسبًا للشراء أو البيع Amp (AMP)، من المهم أولاً أن تتوافق مع إستراتيجيتك الخاصة في التداول وملف المخاطر الخاص بك. غالبًا ما يفسر المستثمرون على المدى الطويل والمتداولون على المدى القصير ظروف السوق بشكل مختلف، لذا يجب أن يعكس قرارك نهجك الشخصي. استنادًا إلى أحدث تحليل تقني لمدة 4 ساعات لـ AMP، فإن إشارة التداول الحالية هي الحيازة. وفقًا لأحدث تحليل تقني لـ AMP لمدة يوم واحد، فإن الإشارة الحالية هي الحيازة.

توقعات Beacon
توقعات الأسعار الاحتمالية (الـ 24 ساعة القادمة)إخلاء مسؤولية توقعات Beacon
يتم تحليل نتائج البيانات المعروضة في هذه الصفحة استنادًا إلى بيانات التداول الفعلية (OHLCV) لزوج التداول المحدد إلى جانب المؤشرات التقنية المقابلة.
هذا التنبؤ هو منتج تقني تجريبي ويتم توفيره لأغراض مرجعية فقط. ولا يشكل نصيحة استثمارية. قد تؤثر الأحداث غير المتوقعة في العالم الحقيقي بشكل كبير في سلوك السوق. يجب على المتداولين اتخاذ القرارات بحذر.
هذا التنبؤ هو منتج تقني تجريبي ويتم توفيره لأغراض مرجعية فقط. ولا يشكل نصيحة استثمارية. قد تؤثر الأحداث غير المتوقعة في العالم الحقيقي بشكل كبير في سلوك السوق. يجب على المتداولين اتخاذ القرارات بحذر.
حول Amp
Amp (AMP) is a cryptocurrency launched in 2020and operates on the Ethereum platform. Amp has a current supply of 99,720,238,122.28571238 with 86,781,193,103.18022 in circulation. The last known price of Amp is 0.00053037 USD and is down -0.72 over the last 24 hours. It is currently trading on 188 active market(s) with $7,906,755.96 traded over the last 24 hours. More information can be found at https://amp.xyz.
اقرأ المزيد
الروابط الرسمية
مستكشف السلاسل


شراء AMP
التداول AMP