

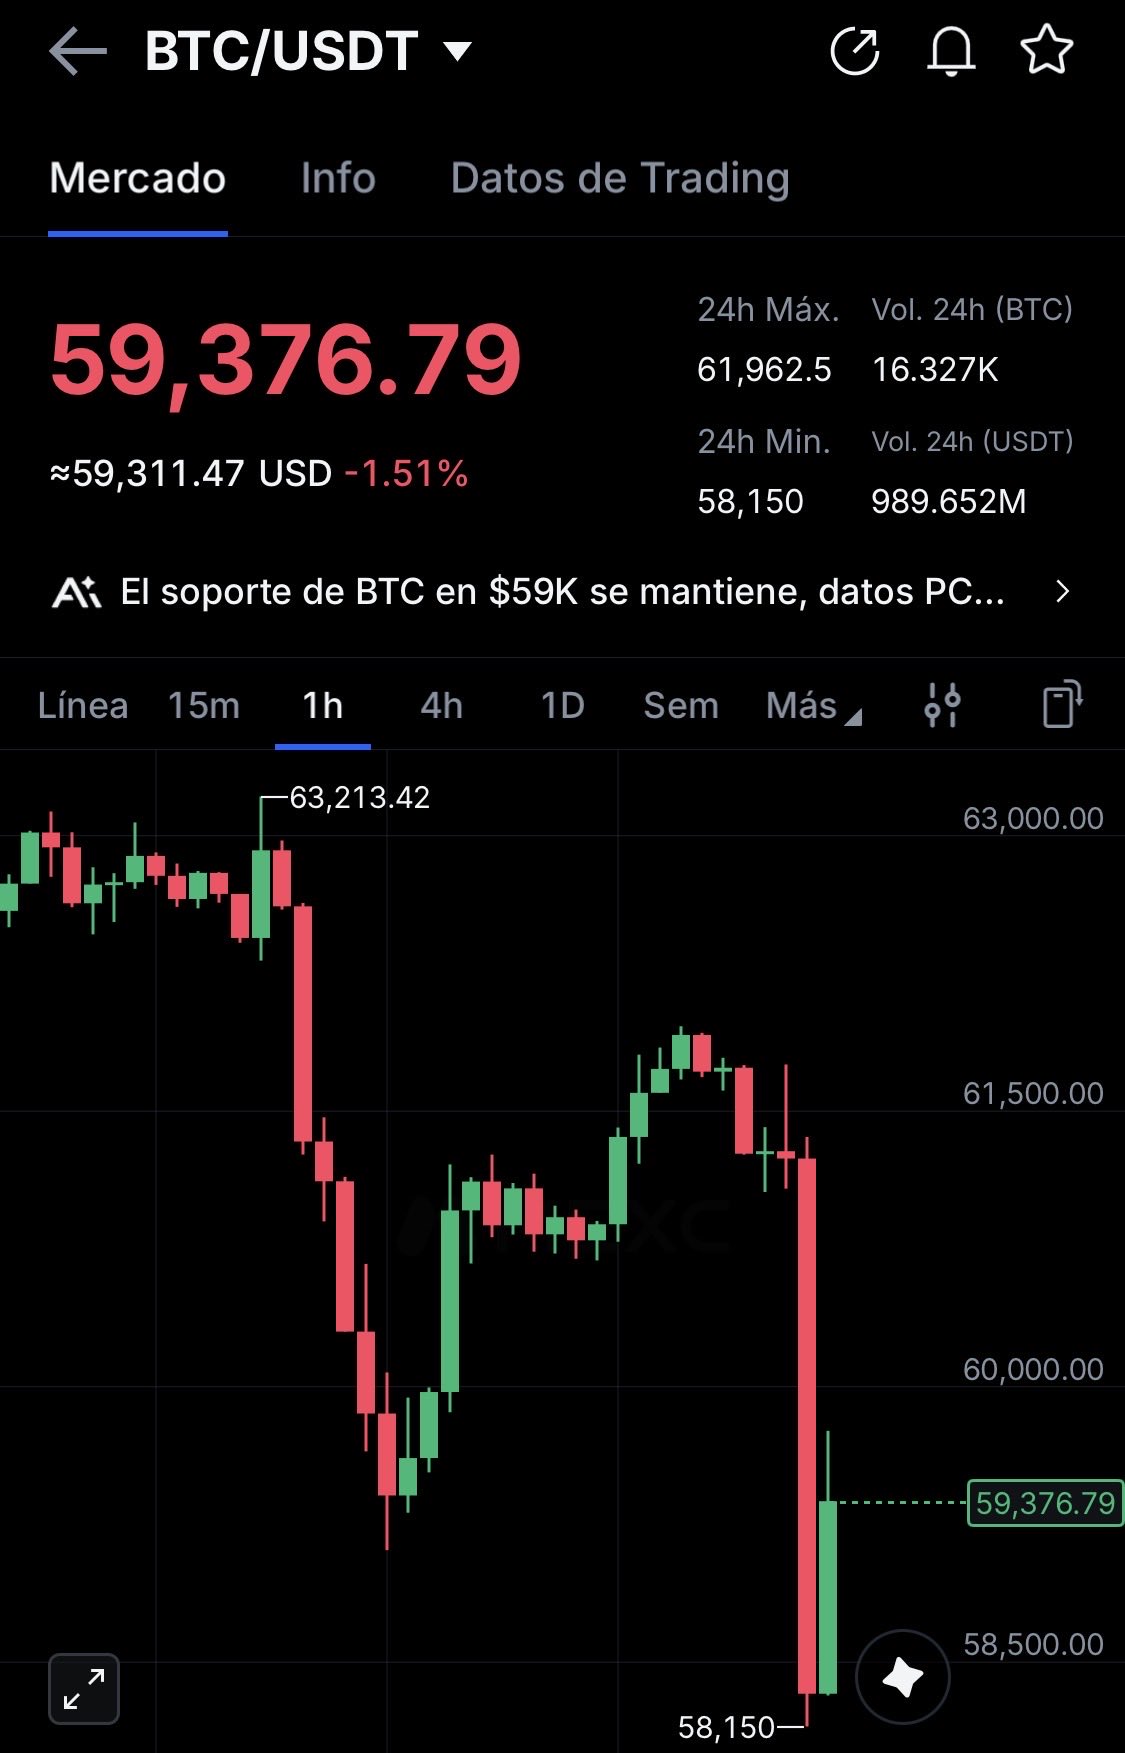
🚨PRICE ALERT🚨
Bitcoin just took a tumble below 59k 👀‼️ https://t.co/pHMXTY2TVB


 310.3K @healthy_pockets
 🚨PRICE ALERT🚨
Bitcoin just took a tumble below 59k 👀‼️ https://t.co/pHMXTY2TVB
 3
3
 0
0
 1.3K
1.3K
 233.0K @StackerSatoshi
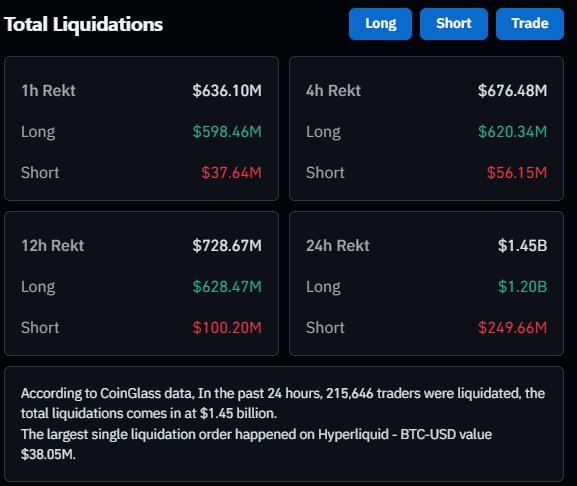
 That was a HUGE liquidation cascade to start the US session with $600M of longs liquidated in a single hour and $1.2B of longs rekt over the past 24 hours. https://t.co/tpZuAZDgLa
 4
0
3.3K
4
0
3.3K
 1.4M @BSCNews
 Over $450 million in leveraged long positions were liquidated in just 60 minutes as Bitcoin fell below $60k...
Rekt June?
 4.2M @WatcherGuru
 JUST IN: $500,000,000 liquidated from the crypto market in the past 60 minutes. https://t.co/ZVQfGyqCAq
 4
0
6.3K
4
0
6.3K

Bitcoin (BTC) is a digital asset and a payment system invented by Satoshi Nakamoto who published a related paper in 2008 and released it as open-source software in 2009. The system featured as peer-to-peer; users can transact directly without an intermediary. Transactions are verified by network nodes and recorded in a public distributed ledger called the blockchain. The ledger uses bitcoin as its unit of account. The system works without a central repository or single administrator, which has led the U.S. Treasury to categorize bitcoin as a decentralized virtual currency. Bitcoin is often called the first cryptocurrency, although prior systems existed. Bitcoin is more correctly described as the first decentralized digital currency. It is the largest of its kind in terms of total market value by now.


