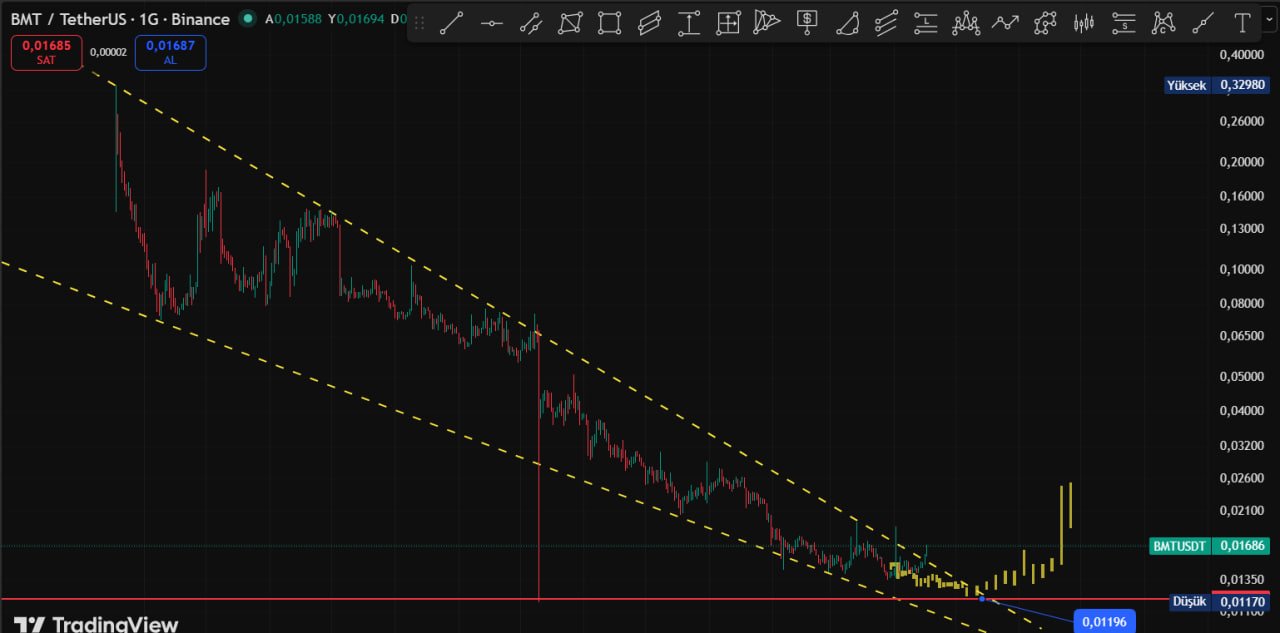
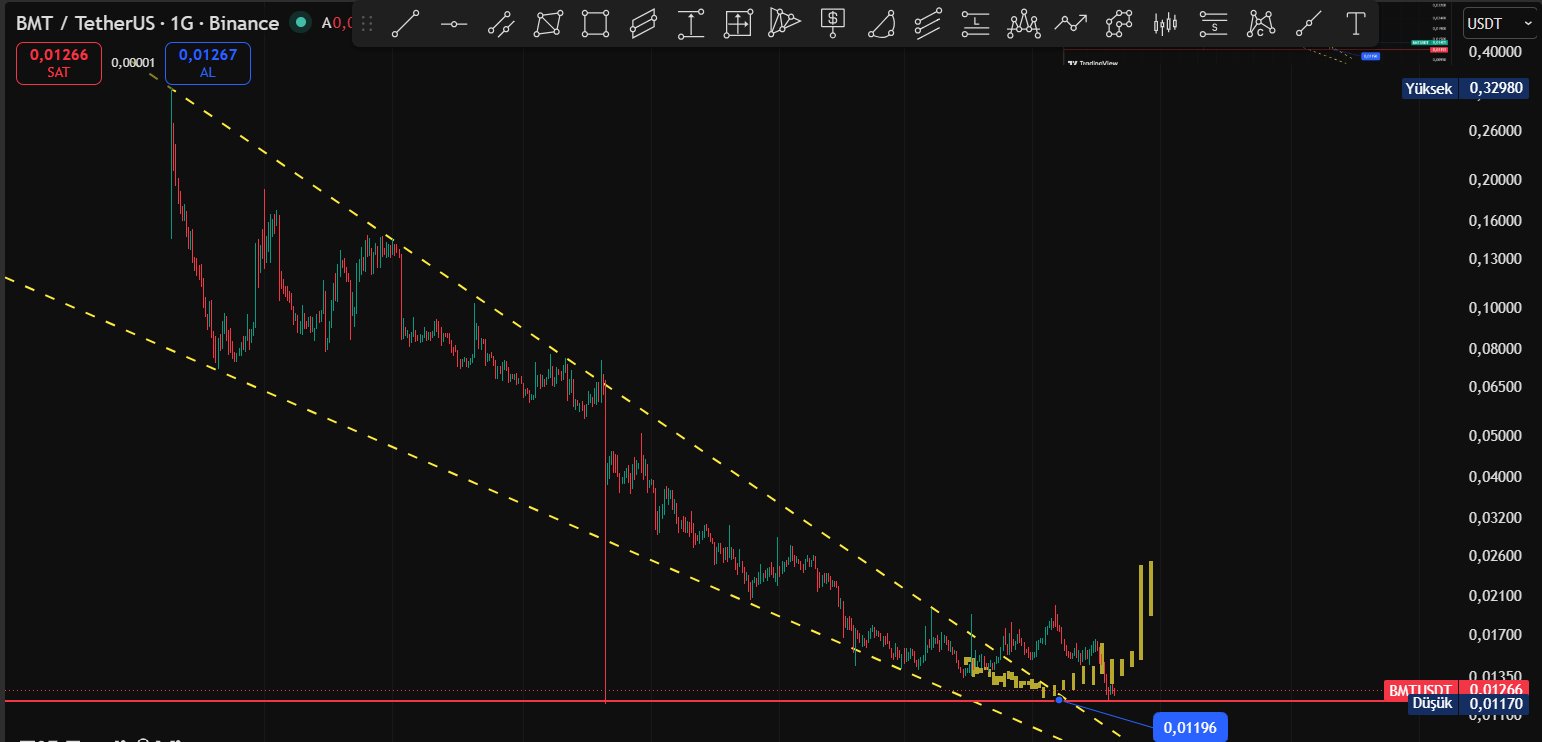
#BMT
Reached the support region. 👍👍 It's worthwhile to keep watching for a while longer. https://t.co/SSkPz6GYxX


 27.8K @Cyriptoman4
 #BMT
Reached the support region. 👍👍 It's worthwhile to keep watching for a while longer. https://t.co/SSkPz6GYxX
 69
69
 2
2
 1.9K
1.9K
 35.4K @CryptoScamHuntO
 I don’t use bots, tools, or websites. I only sleuth on-chain directly on launchpads, Solscan, Etherscan, Basescan…
The ONLY tool I use before any deep dive is @bubblemaps 🫧 🫧
It’s the BEST so far! Though alone it still can’t tell me if a coin is a scam when the scammer is smart.
Some noise around the valuation of $BMT, but guys… do you really give a f*ck about the valuation of huge scams that hit hundreds of millions? 💀
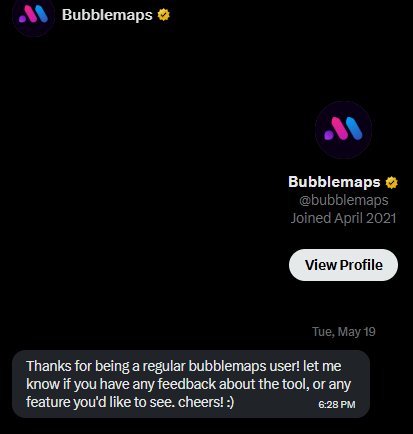
Congrats to Nicolas Vaiman and his team for the great work.
This DM shows how committed you are about making your tool better for users - for FREE ❤️ 💫
As a small on-chain detective at my scale with limited knowledge, it helps. THANK YOU. 💙💙💙
I’ll try to DM you some basic points I wish could be improved.
🌟 Disclaimer: Bubblemaps and I never connected before. This is the first time they DMed me. I don’t hold $BMT.
 34
6
3.0K
34
6
3.0K
 280.9K @bubblemaps
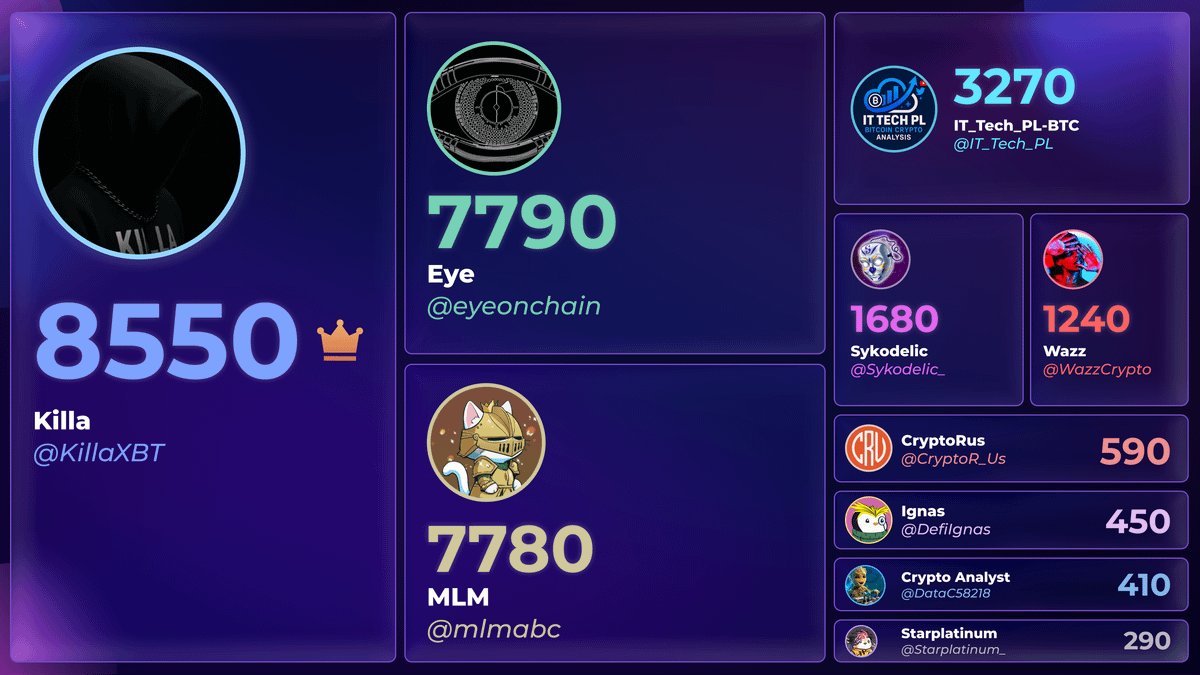
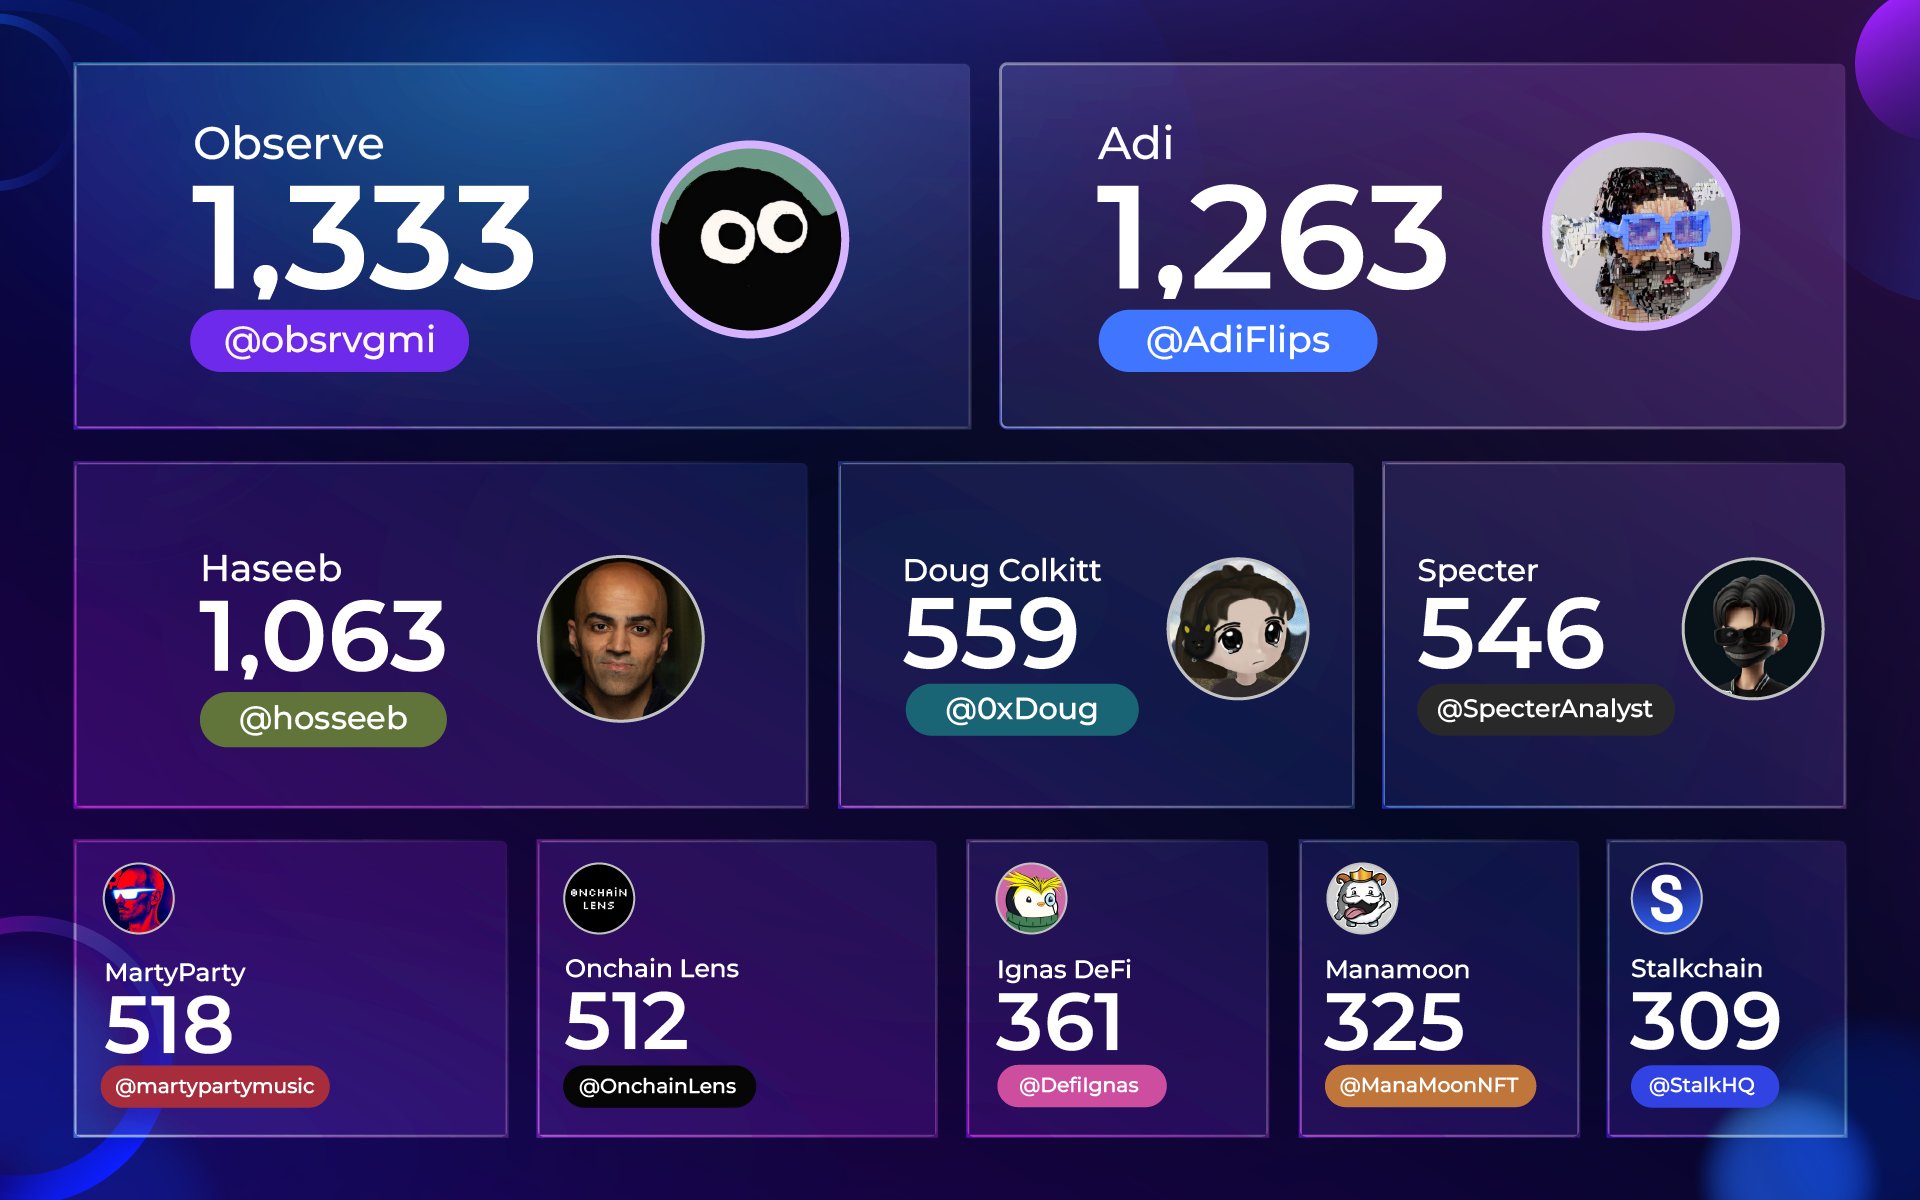
 The Intel Desk leaderboard for the last 3 months is here 🏆
100,000 $BMT will be distributed among the winners
Here are the results ↓ 🧵 https://t.co/WiH1KMgff4 https://t.co/KJkdIiJnL6
 280.9K @bubblemaps
 Congrats to the top 10 Intel Desk contributors! (Part 2)
You delivered strong research in the last quarter and earned the 100,000 $BMT reward
Read more ↓🧵 https://t.co/CMDZ4CeTpe
 2
1
106
2
1
106