🔔The End of an Era: ICON Network Confirms Shutdown Plan and Final @sodaholders Migration Schedule
The crypto landscape is evolving, and so are its pioneers. ICON has officially announced the final timeline for its historic transition to SODAX:
the ICON Network will be permanently halted on December 31, 2026.
https://t.co/vOrofQUpvQ
شراء العملات المشفرة
بطاقة
تداول P2P
اشتر USDT عبر السوق
بطاقة الائتمان/الخصم
اشترِ العملات المشفرة باستخدام Visa أو Mastercard
الدفع من جهة خارجية
اشترِ العملات المشفرة عبر MoonPay و Simplex والمزيد
بطاقة بيتمارت
تعزيز قدرات حياتك في مجال العملات المشفرة
بطاقة مسبقة الدفع للعملات المشفرة
احصل على بطاقة ماستركارد صالحة للاستخدام فورًا
Rewards
السحب اليومي للحسابات الآجلة
فرصة ربح مضمونة بنسبة 100% مع التداولات اليومية
السحب اليومي لحساب فوري
اكسب 8888 USDT في الجوائز الكبرى
شحن رصيد الهاتف المحمول
شحن الرصيد بسهولة، عبر الإنترنت، وبأمان
Send
Send money globally, fast and secure
BitMart Mall
بث مباشر للعملات المشفرة

ICON (ICX)
$ 0.029 (ICX/USD)
0.00%
24H
ICON بيانات الأسعار المباشرة
سعر اليوم لـ ICON هو $ 0.029 (ICX/USD). بقيمة سوقية تبلغ $ 32.87M USD. حجم التداول خلال 24 ساعة لـ $ 694.55K USD، تغير السعر خلال 24 ساعة بمقدار +0.00%، وإمداد متداول قدره 1.10B ICX.
ICON ICX سجل الأسعار USD
تتبع سعر ICON لليوم، و7 أيام، و30 يومًا، و90 يومًا
الفترة
تغير
التغير (%)
اليوم
$ 0
0.00%
7أيام
$ 0
0.00%
30أيام
$ 0.0099
-25.00%
90أيام
$ 0.0099
-25.00%
امتلك ICX الآن
اشترِ وبع ICX بسهولة وأمان على BitMart.
ICON معلومات السوق
$ 0.029 مدى 24سا $ 0.029
أعلى مستوى على الإطلاق
$ 0.059
أدنى مستوى على الإطلاق
$ 0.029
تغير24سا
0.00%
حجم 24سا
$ 694,551.57
الإمداد المتداول
1.09B
ICX
القيمة السوقية
$ 32.87M
الحد الأقصى للإمداد
--
القيمة السوقية المخففة بالكامل
$ 33.22M
التداول ICX
ICON رؤى X

Aalexxx™
Media
Researcher
C
 3.6K @Aaleks_crypt
 هابط بشدة
ICON will shut down on December 31, 2026, and holders must migrate to SODA.
 2
2
 0
0
 28
28
2026-05-27 12:38
اتجاه ICX بعد الإصدار
هابط
ICON will shut down on December 31, 2026, and holders must migrate to SODA.

吴说区块链
Media
Educator
D
177.6K @wublockchain12 هابط بشدة
ICX will shut down its network on December 31, 2026 and migrate to SODA, outlook bleak
South Korea's veteran public chain ICON announced that it will officially shut down its network on December 31, 2026, and complete the migration to SODAX. The official stated that the final migration deadline from ICX to SODA is also December 31, 2026, after which ICX will no longer be able to migrate. ICON said that as cross-chain and liquidity infrastructure mature, maintaining the Layer 1 no longer aligns with the project's direction. https://t.co/cqZvbnvoT2
2
2
2.9K
2026-05-25 14:56
اتجاه ICX بعد الإصدار
هابط
ICX will shut down its network on December 31, 2026 and migrate to SODA, outlook bleak

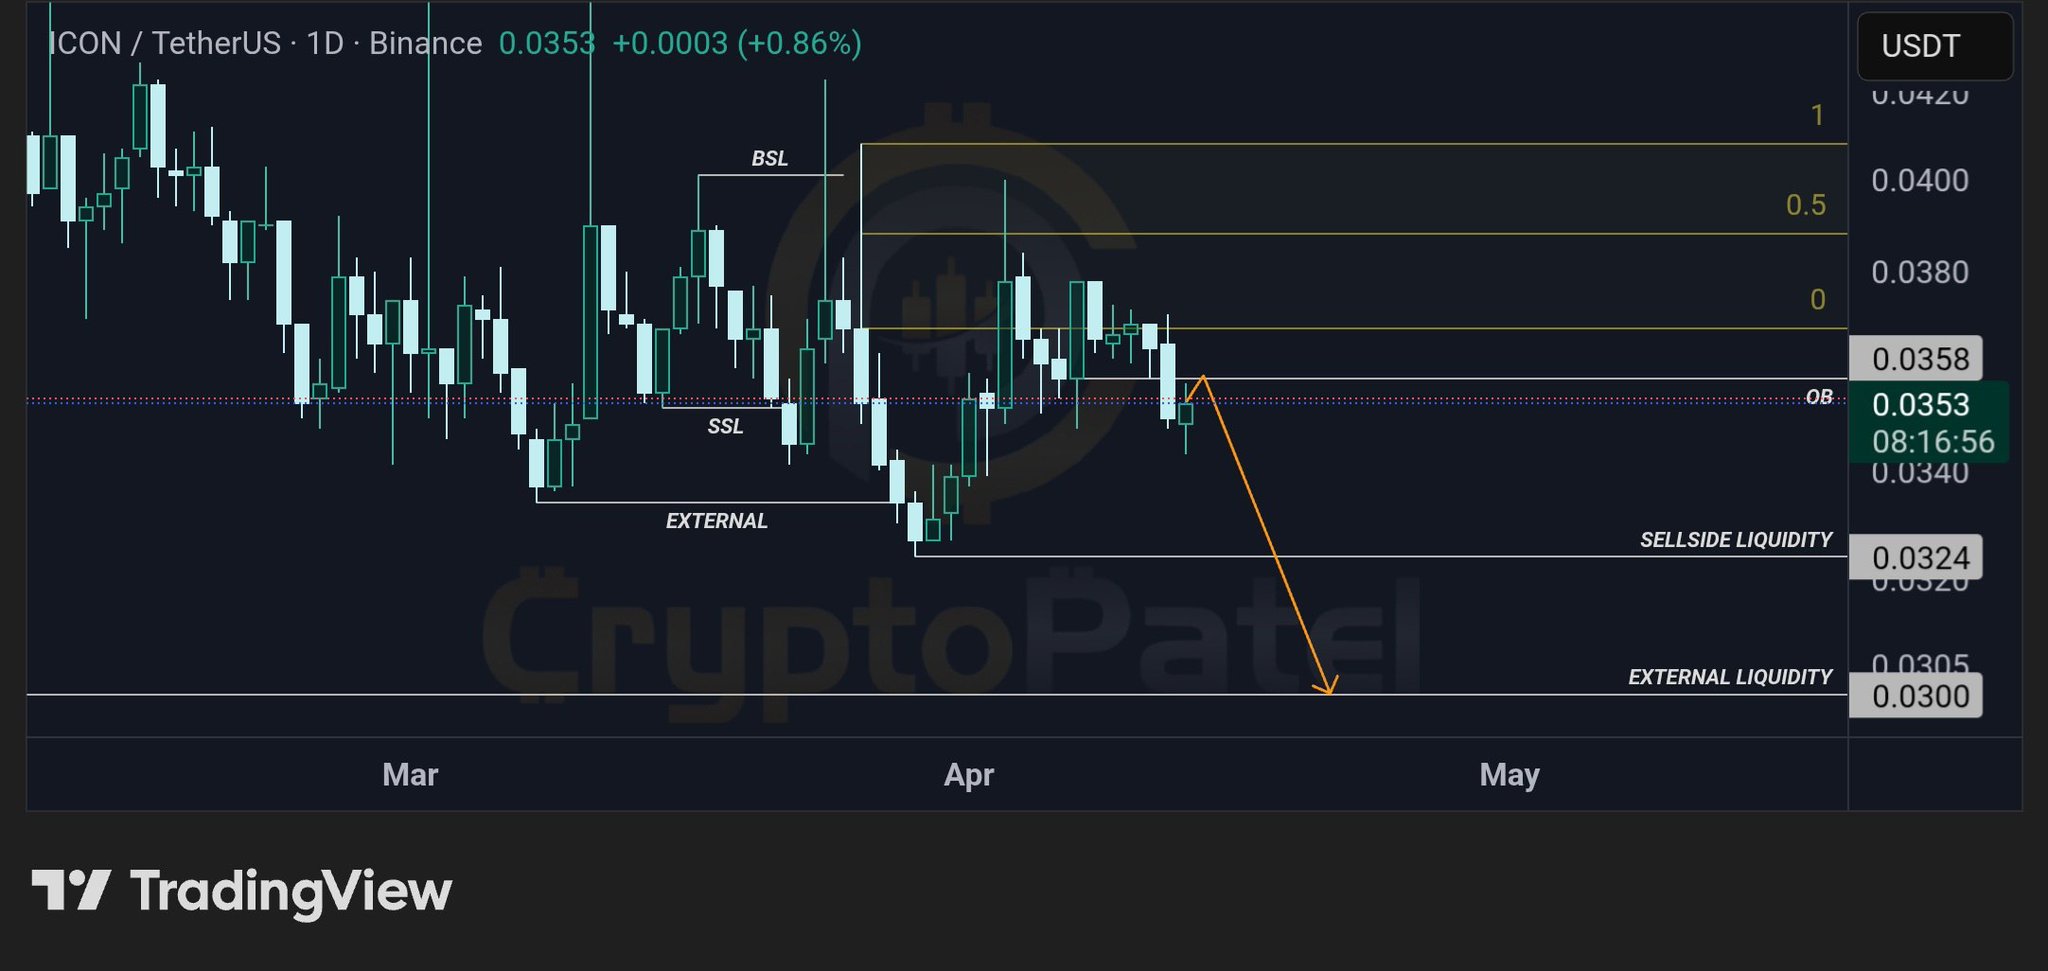
Crypto Patel
TA_Analyst
OnChain_Analyst
B
60.9K @CryptoPatel هابط
ICX technical outlook shows weakness, expected to continue falling to $0.0324‑$0.0300.
$ICX/USDT 1D SETUP | BEARISH CONTINUATION TOWARD SELL-SIDE LIQUIDITY
#ICX is reacting from a higher timeframe order block in a premium zone, showing weak bullish continuation and signs of distribution, favoring downside continuation toward liquidity below.
Technical Structure:
✅ Daily Order Block → strong resistance in premium zone
✅ Prior rejection → bearish intent confirmed
✅ Weak bullish continuation → distribution behavior
✅ HTF bearish structure forming
✅ Liquidity below → clear downside targets
Targets: $0.0324 → $0.0300
Invalidation: 1D close above $0.0387
Bearish bias. Wait for minor pullback / rejection inside OB and confirmation before entering toward sell-side liquidity.
TA Only. DYOR.
 230
11
5.7K
230
11
5.7K
2026-04-14 05:33
اتجاه ICX بعد الإصدار
هابط بشدة
ICX technical outlook shows weakness, expected to continue falling to $0.0324‑$0.0300.
توقع السعر
متى يكون الوقت المناسب لشراء ICX؟ هل يجب أن أشتري ICX أو أبيعه الآن؟
عند اتخاذ قرار ما إذا كان الوقت مناسبًا للشراء أو البيع ICON (ICX)، من المهم أولاً أن تتوافق مع إستراتيجيتك الخاصة في التداول وملف المخاطر الخاص بك. غالبًا ما يفسر المستثمرون على المدى الطويل والمتداولون على المدى القصير ظروف السوق بشكل مختلف، لذا يجب أن يعكس قرارك نهجك الشخصي. استنادًا إلى أحدث تحليل تقني لمدة 4 ساعات لـ ICX، فإن إشارة التداول الحالية هي الحيازة. وفقًا لأحدث تحليل تقني لـ ICX لمدة يوم واحد، فإن الإشارة الحالية هي الحيازة.

توقعات Beacon
توقعات الأسعار الاحتمالية (الـ 24 ساعة القادمة)إخلاء مسؤولية توقعات Beacon
يتم تحليل نتائج البيانات المعروضة في هذه الصفحة استنادًا إلى بيانات التداول الفعلية (OHLCV) لزوج التداول المحدد إلى جانب المؤشرات التقنية المقابلة.
هذا التنبؤ هو منتج تقني تجريبي ويتم توفيره لأغراض مرجعية فقط. ولا يشكل نصيحة استثمارية. قد تؤثر الأحداث غير المتوقعة في العالم الحقيقي بشكل كبير في سلوك السوق. يجب على المتداولين اتخاذ القرارات بحذر.
هذا التنبؤ هو منتج تقني تجريبي ويتم توفيره لأغراض مرجعية فقط. ولا يشكل نصيحة استثمارية. قد تؤثر الأحداث غير المتوقعة في العالم الحقيقي بشكل كبير في سلوك السوق. يجب على المتداولين اتخاذ القرارات بحذر.
حول ICON
ICON (ICX) is a cryptocurrency . ICON has a current supply of 1,108,792,174.2180953 with 1,097,115,985.7391582 in circulation. The last known price of ICON is 0.02879669 USD and is down -0.90 over the last 24 hours. It is currently trading on 168 active market(s) with $1,351,520.55 traded over the last 24 hours. More information can be found at https://icon.community.
اقرأ المزيد
الروابط الرسمية
مستكشف السلاسل