$DASH looks like one of the most asymmetric setups on the monthly chart.
Nobody wants it.
Nobody is talking about it.
That’s usually where the biggest opportunities begin.
For years,
price has been building a base
while most of the market completely lost interest.
But the chart tells a different story.
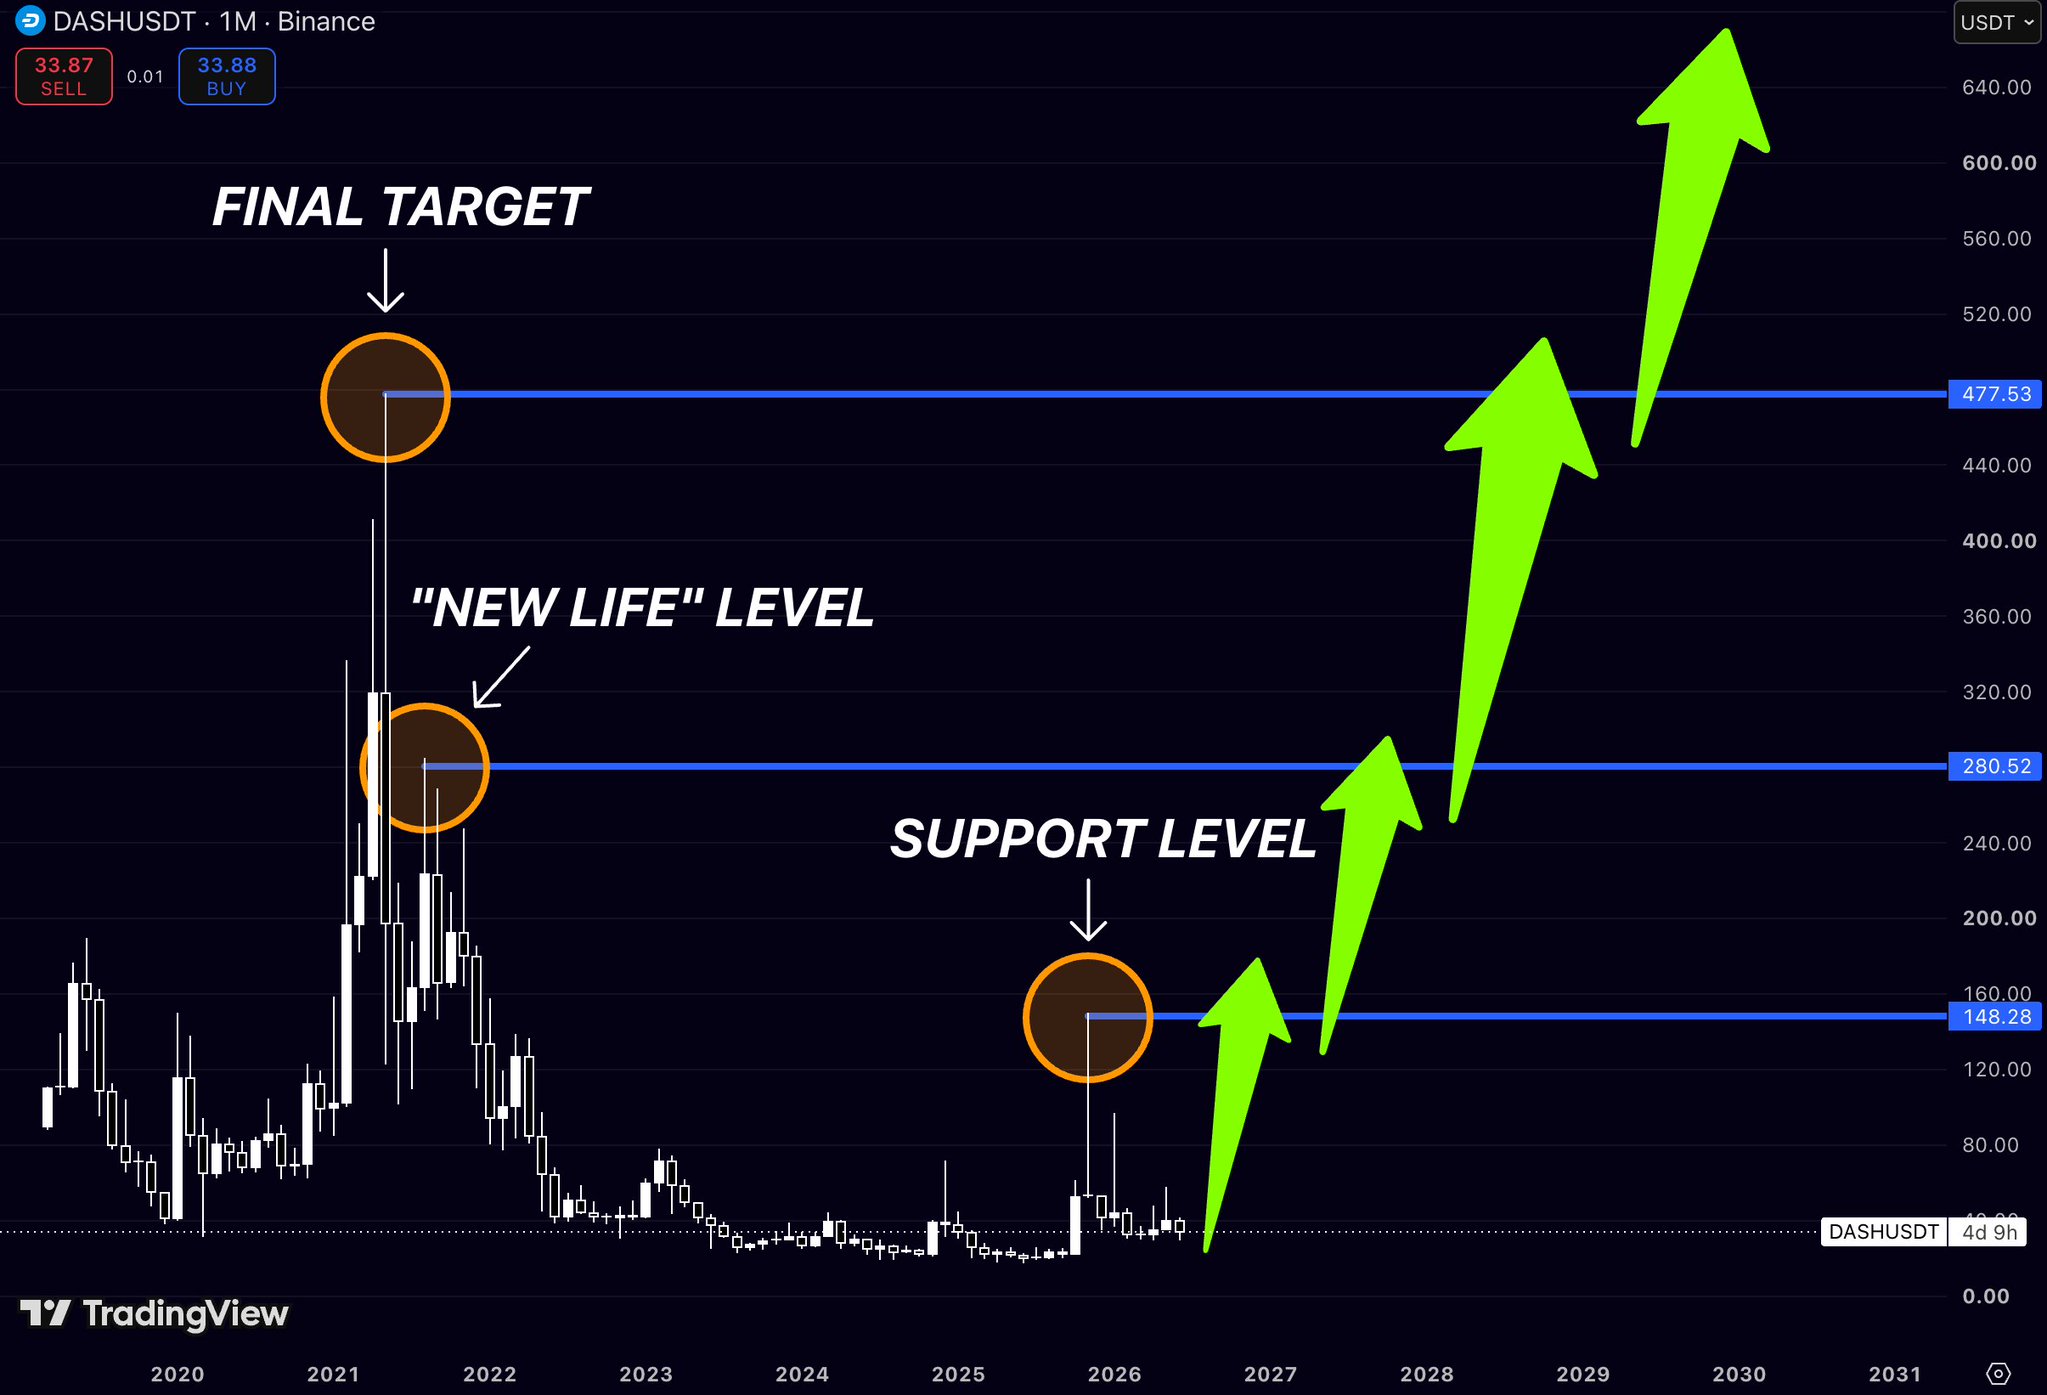
There are three major historical levels
that have defined every previous cycle.
📍Around $148
the first major resistance.
This is where momentum could return
and sentiment starts shifting.
📍Around $280
the level that changes everything.
If bulls reclaim it,
$DASH enters an entirely different market structure.
That’s where the real trend usually begins.
And finally…
📍Around $477
the previous cycle’s major distribution zone.
A level that once looked impossible
became reality before.
Markets have a habit of repeating themselves.
Especially after years of accumulation.
Most people wait until an asset is already trending.
The best risk/reward usually exists
while everyone is still ignoring it.
$DASH might be much closer to that moment
than most people realize.