🔔The End of an Era: ICON Network Confirms Shutdown Plan and Final @sodaholders Migration Schedule
The crypto landscape is evolving, and so are its pioneers. ICON has officially announced the final timeline for its historic transition to SODAX:
the ICON Network will be permanently halted on December 31, 2026.
https://t.co/vOrofQUpvQ
Rewards
Futures Daily Draw
100% Chance To Win With Daily Trades
Spot Daily Draw
Win 8,888 USDT In Grand Prizes
Mobile Top-Up
Top up mobiles easily, online, secure
Send
Send money globally, fast and secure
BitMart Mall
Live on crypto

ICON (ICX)
$ 0.029 (ICX/USD)
0.00%
24H
ICON Live Price data
Today's price of ICON Is $ 0.029 (ICX/USD). With A Market Cap Of $ 32.88M USD. 24-Hour Trading Volume Of $ 689.05K USD, A 24-Hour Price Change Of +0.00%, And A Circulating Supply Of 1.10B ICX.
ICON ICX Price History USD
Track the price of ICON for today, 7 days, 30 days and 90 days
Period
Change
Change (%)
Today
$ 0
0.00%
7days
$ 0
0.00%
30days
$ 0.0099
-25.00%
90days
$ 0.0099
-25.00%
Own ICX Now
Buy and sell ICX easily and securely on BitMart.
ICON Market Information
$ 0.029 24h Range $ 0.029
All time high
$ 0.059
All time low
$ 0.029
24h Change
0.00%
24h Vol
$ 689,051.88
Circulating supply
1.09B
ICX
Market cap
$ 32.88M
Max supply
--
Fully diluted market cap
$ 33.23M
Trade ICX
ICON X Insight

Aalexxx™
Media
Researcher
C
 3.6K @Aaleks_crypt
 Extremely Bearish
ICON will shut down on December 31, 2026, and holders must migrate to SODA.
 2
2
 0
0
 28
28
2026-05-27 12:38
Trend of ICX after release
Bearish
ICON will shut down on December 31, 2026, and holders must migrate to SODA.

吴说区块链
Media
Educator
D
177.6K @wublockchain12 Extremely Bearish
ICX will shut down its network on December 31, 2026 and migrate to SODA, outlook bleak
South Korea's veteran public chain ICON announced that it will officially shut down its network on December 31, 2026, and complete the migration to SODAX. The official stated that the final migration deadline from ICX to SODA is also December 31, 2026, after which ICX will no longer be able to migrate. ICON said that as cross-chain and liquidity infrastructure mature, maintaining the Layer 1 no longer aligns with the project's direction. https://t.co/cqZvbnvoT2
2
2
2.9K
2026-05-25 14:56
Trend of ICX after release
Bearish
ICX will shut down its network on December 31, 2026 and migrate to SODA, outlook bleak

Crypto Patel
TA_Analyst
OnChain_Analyst
B
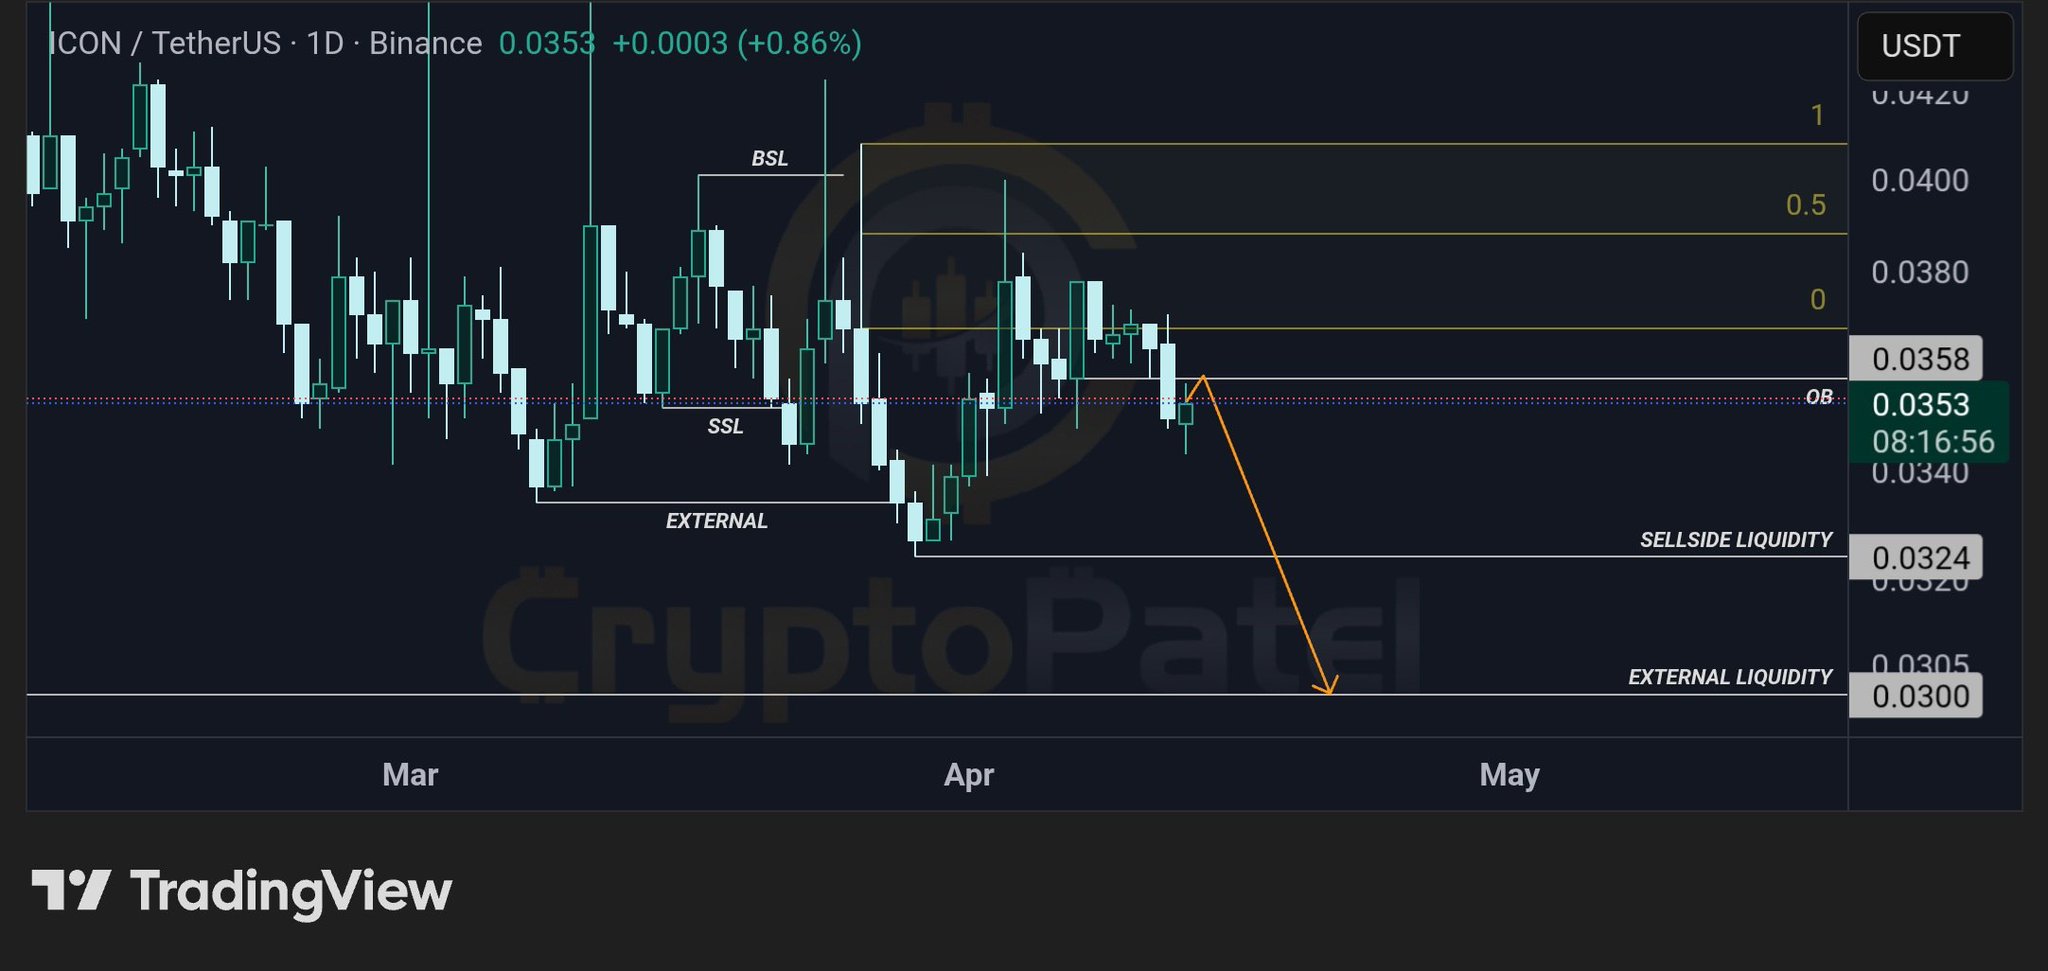
60.9K @CryptoPatel Bearish
ICX technical outlook shows weakness, expected to continue falling to $0.0324‑$0.0300.
$ICX/USDT 1D SETUP | BEARISH CONTINUATION TOWARD SELL-SIDE LIQUIDITY
#ICX is reacting from a higher timeframe order block in a premium zone, showing weak bullish continuation and signs of distribution, favoring downside continuation toward liquidity below.
Technical Structure:
✅ Daily Order Block → strong resistance in premium zone
✅ Prior rejection → bearish intent confirmed
✅ Weak bullish continuation → distribution behavior
✅ HTF bearish structure forming
✅ Liquidity below → clear downside targets
Targets: $0.0324 → $0.0300
Invalidation: 1D close above $0.0387
Bearish bias. Wait for minor pullback / rejection inside OB and confirmation before entering toward sell-side liquidity.
TA Only. DYOR.
 230
11
5.7K
230
11
5.7K
2026-04-14 05:33
Trend of ICX after release
Extremely Bearish
ICX technical outlook shows weakness, expected to continue falling to $0.0324‑$0.0300.
Price Prediction
When is a good time to buy ICX? Should I buy or sell ICX now?
When deciding whether it’s a good time to buy or sell ICON (ICX), it’s important to first align with your own trading strategy and risk profile.Long-term investors and short-term traders often interpret market conditions differently, so your decision should reflect your personal approach. According to the latest ICX 4-hour technical analysis, the current trading signal is Hold. According to the latest ICX 1-day technical analysis, the current signal is Hold.

Beacon Prediction
Probabilistic Price Forecast (Next 24 Hours)Beacon Prediction Disclaimer
The data results displayed on this page are analyzed based on actual trading data (OHLCV) of the selected trading pair along with corresponding technical indicators.
This prediction is an experimental technical product and is provided for reference purposes only. It does not constitute investment advice. Unexpected real-world events may significantly impact market behavior. Traders should make decisions with caution.
This prediction is an experimental technical product and is provided for reference purposes only. It does not constitute investment advice. Unexpected real-world events may significantly impact market behavior. Traders should make decisions with caution.
About ICON
ICON (ICX) is a cryptocurrency . ICON has a current supply of 1,108,792,174.2180953 with 1,097,115,985.7391582 in circulation. The last known price of ICON is 0.02879669 USD and is down -0.90 over the last 24 hours. It is currently trading on 168 active market(s) with $1,351,520.55 traded over the last 24 hours. More information can be found at https://icon.community.
Read More
Official Links
Chain Explorer