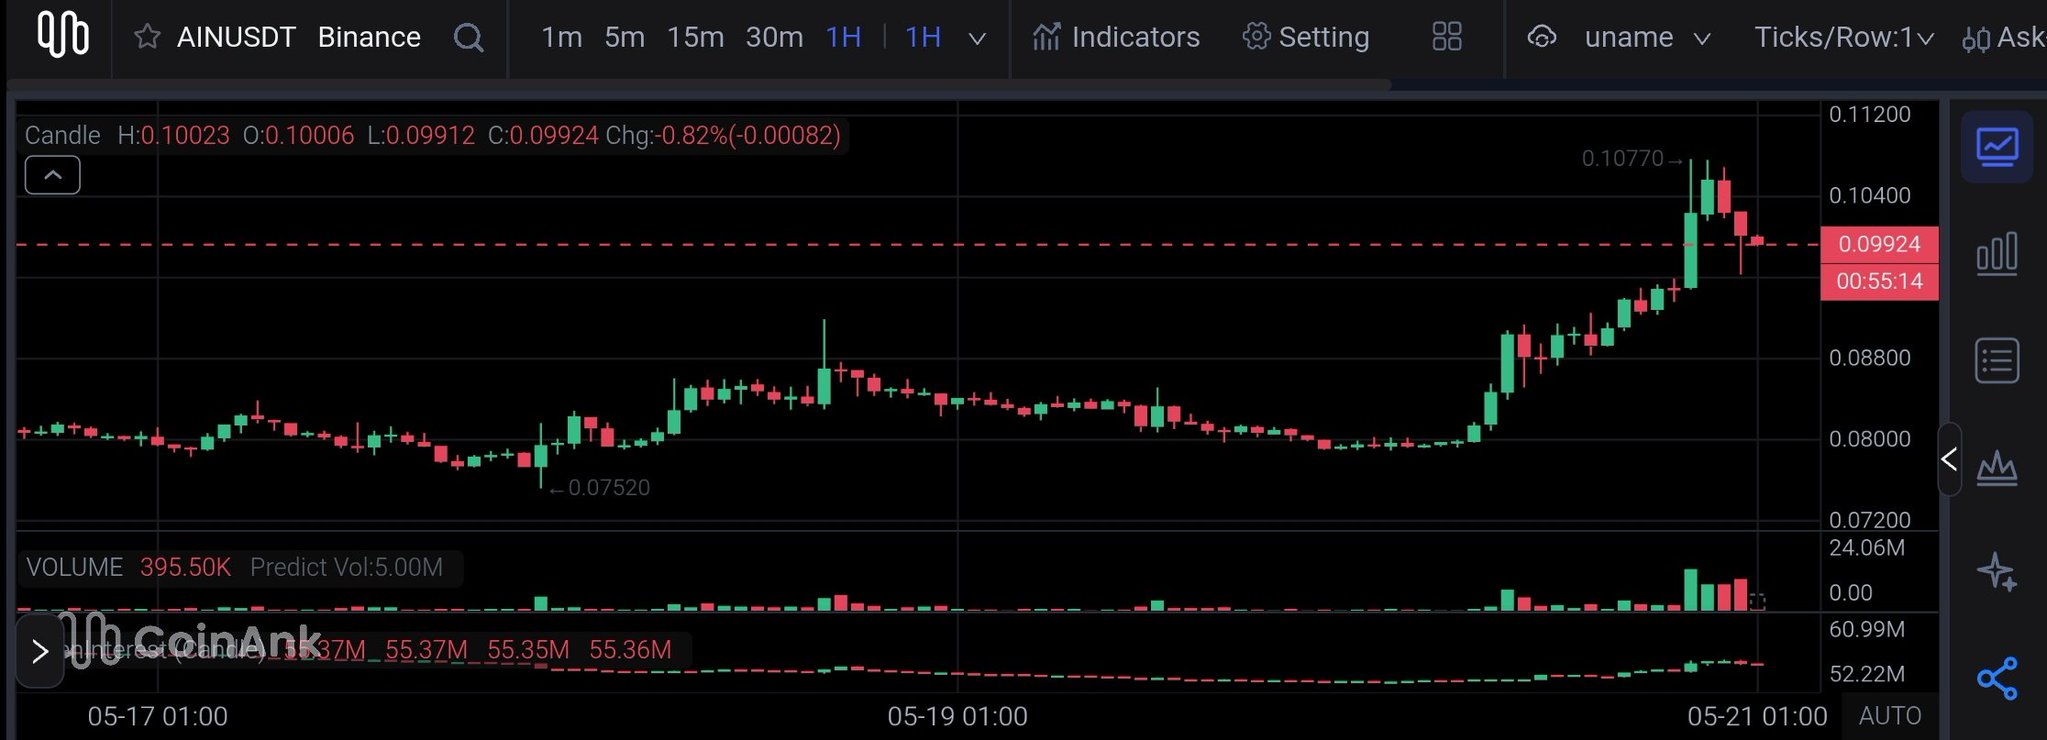
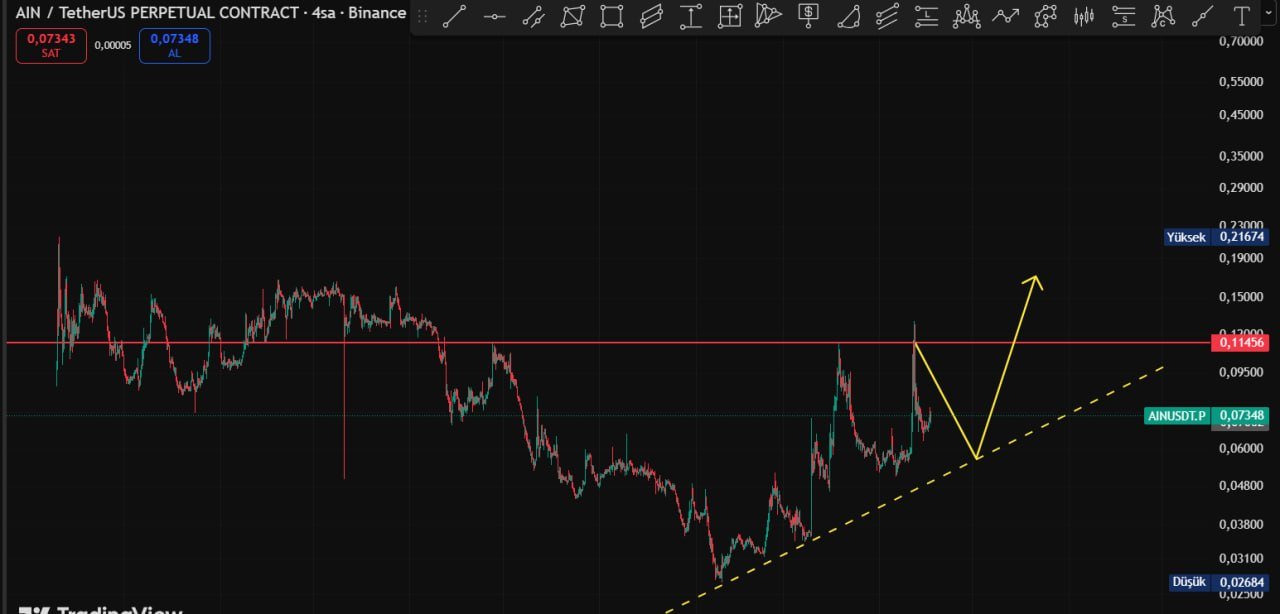
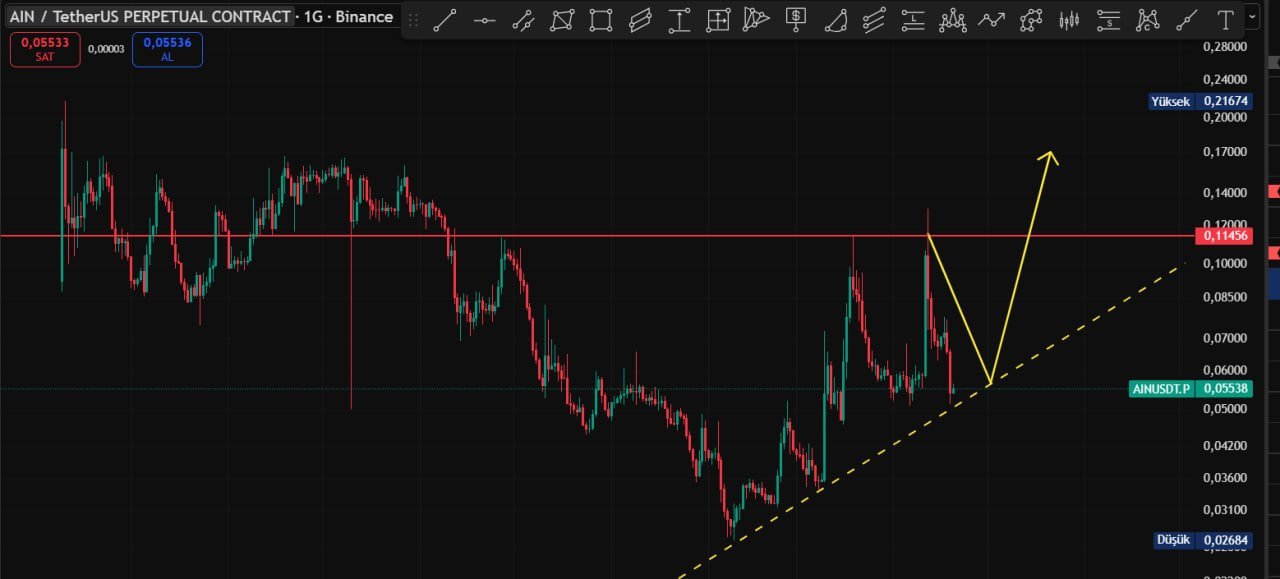
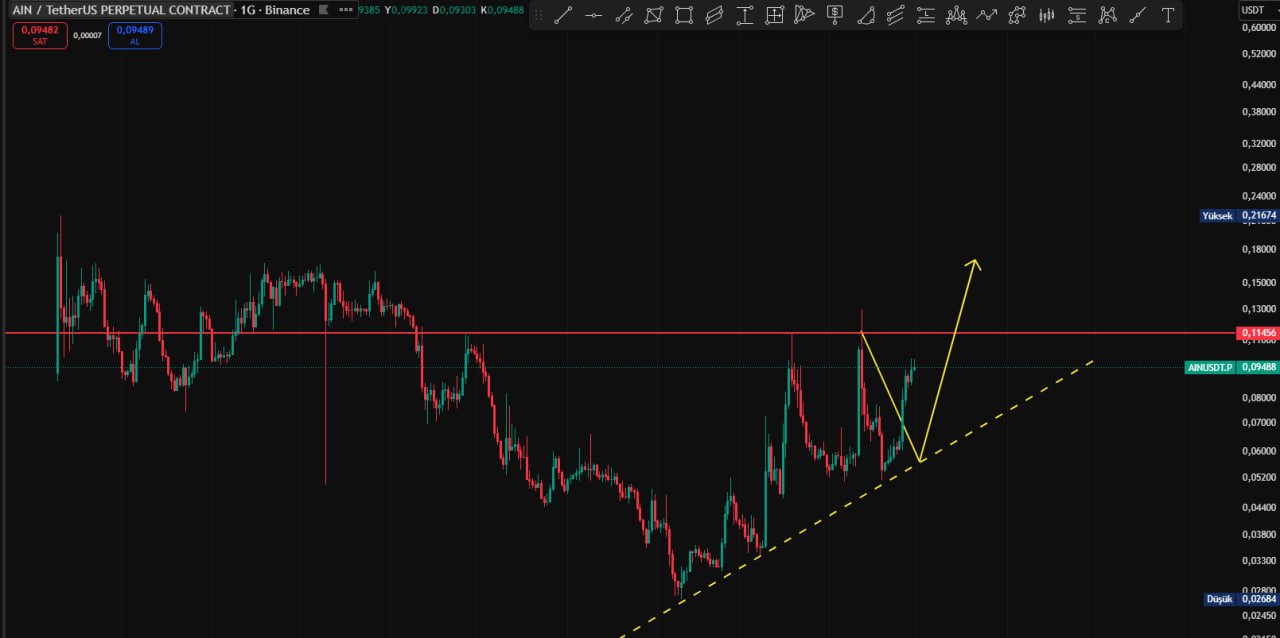
#AINUSDT $AIN #BİNANCE
NEXT 30-50 X
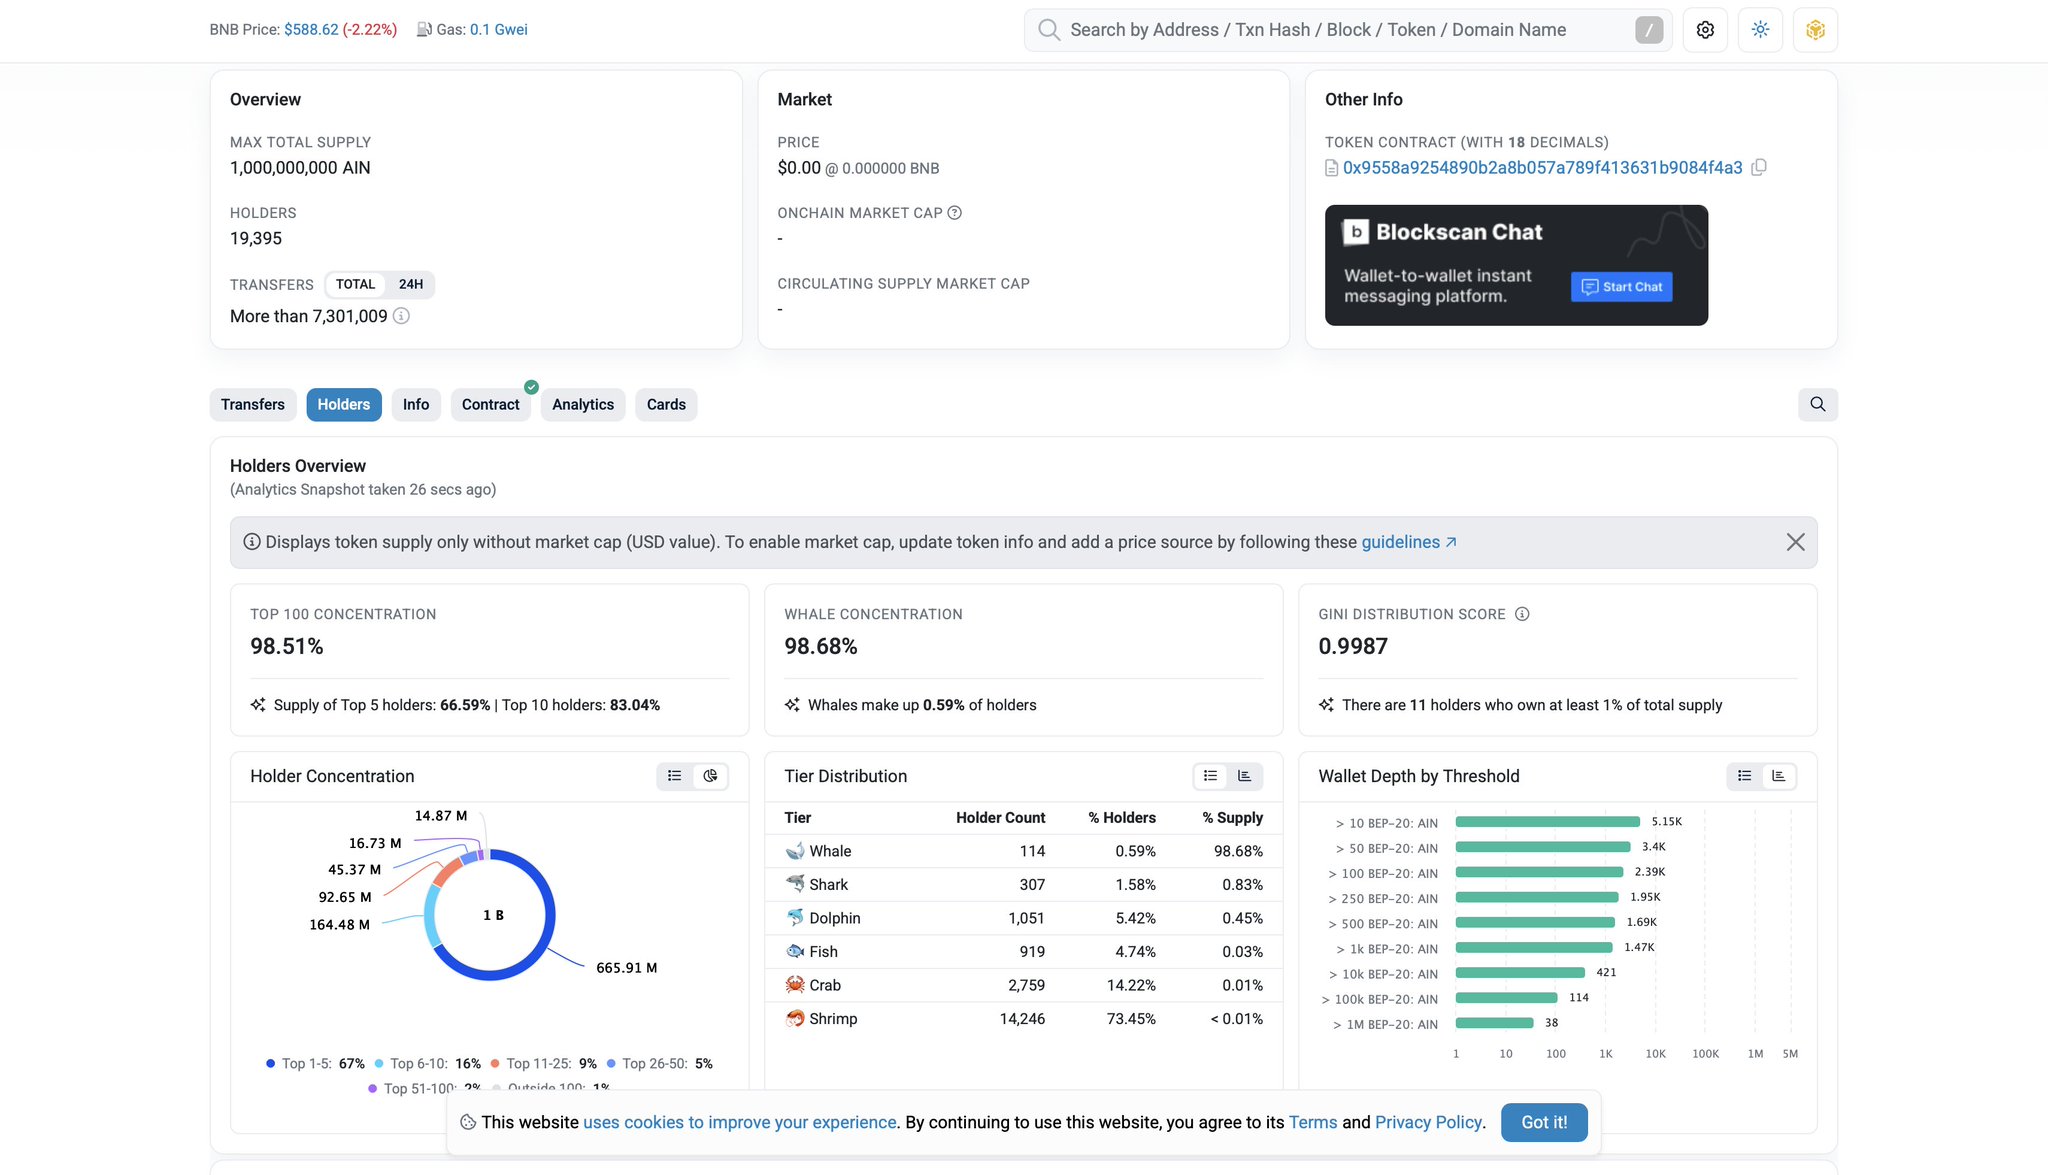
There is extremely high token concentrationThe top 100
wallets hold 98.51% of the total supply.
The top 10 wallets alone control 83.04%.
The top 5 wallets hold 66.59% of the supply.
These figures are unusually high for a typical community-driven token.🐋 Whale dominance is very strongOnly 114 whale wallets own 98.68% of the total supply.
Despite having 19,395 holders, the vast majority of tokens are concentrated in the hands of a small number of wallets.