Why do you keep losing money in the crypto world? Follow @tradinghoex to dissect the manipulation process of $myx and $coai pump‑and‑dump coins, and learn to lose less.
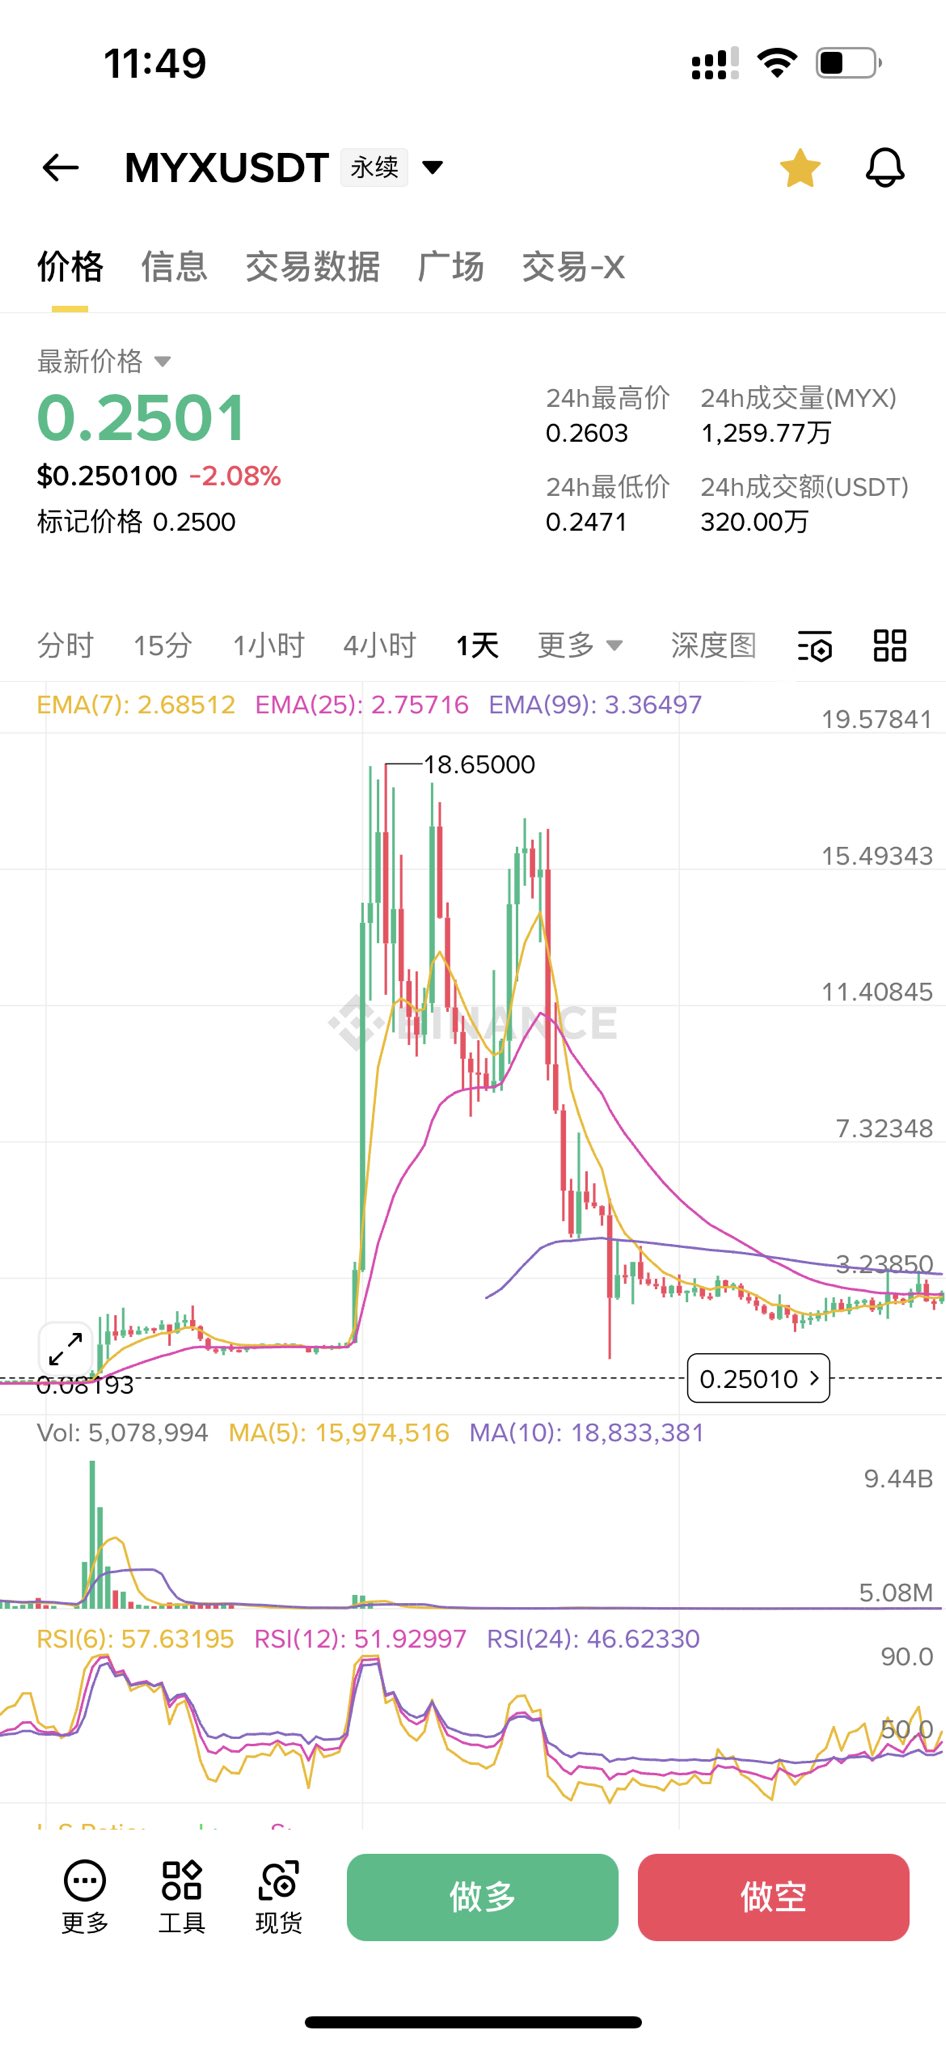
Script 1: Perfect short squeeze, using MYX as an example
This tactic is extremely insidious, targeting short sellers, and squeezes them in five stages:
1. Covert position building (late August 2025): The manipulators, like ants moving, used six wallets to execute 2,240 micro‑buys on PancakeSwap (accumulating $3.92 million) before moving the tokens to a CEX. At the same time, multiple wallets systematically deposited USDT into the liquidity pool (each deposit precisely $19,900 or varying tens of thousands of dollars), rotating operations and silently deepening the pool.
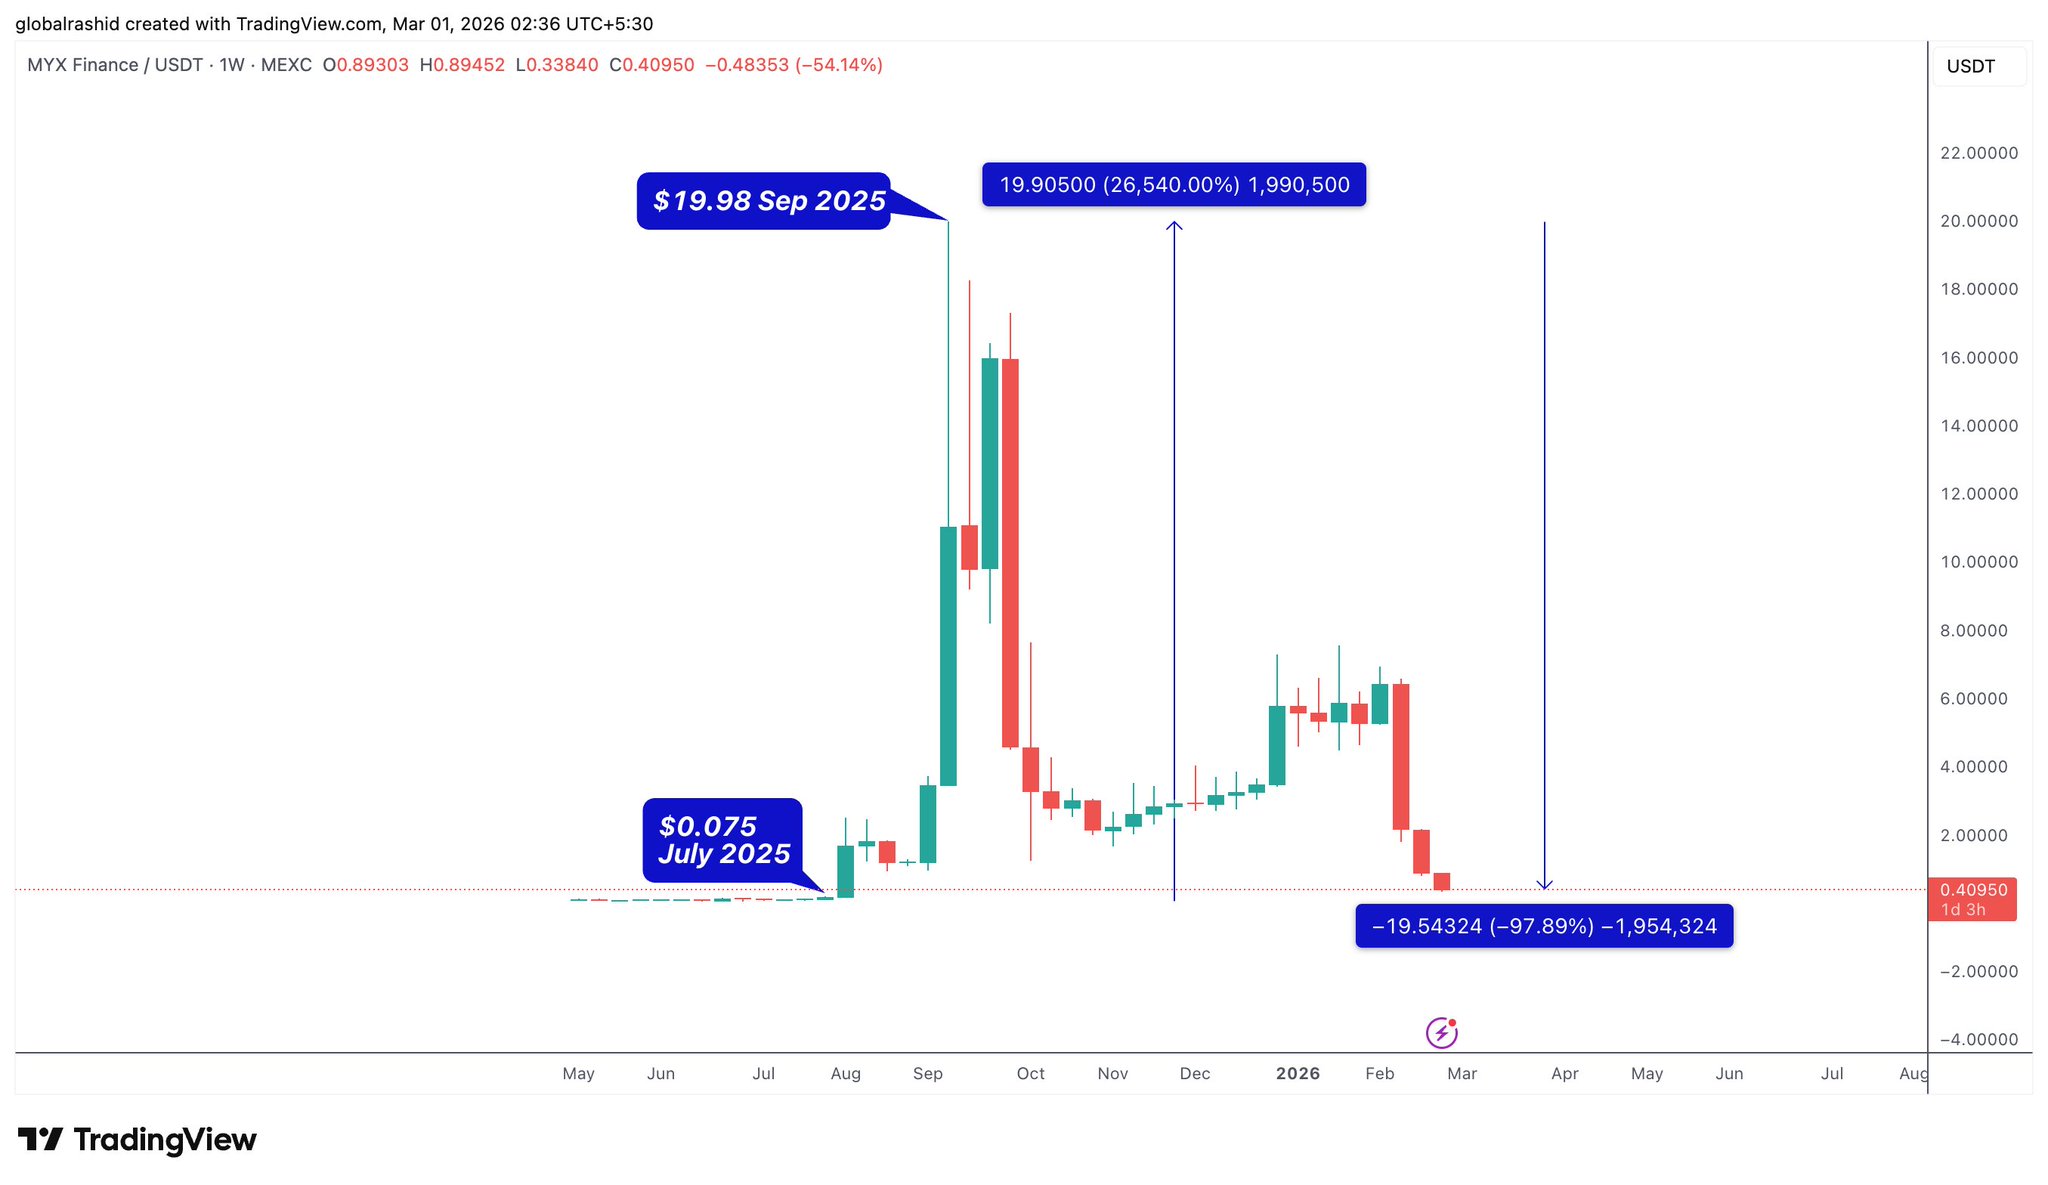
2. Bait the market (early August): The price jumped from $0.10 to $1.29 (a 1,190 % rise in five days). When 39 million tokens unlocked on August 6, the price was $1.65. This explosive rise of a tiny, little‑known token makes retail traders instinctively think “it’s too easy to short.”
3. Set the trap (August 6 – September 6): The price was pegged in a tight $1.05‑$2.00 range for a month. During this period, the funding rate was deeply negative (short sellers had to pay a –12 % rate daily). The chart looked like a clear top, luring massive short positions to rush in.
4. Violent squeeze (September 7 – 10): The trap is revealed! On September 7, open interest (OI) surged and the price instantly doubled from $1.31 to $3.39. On September 8 it surged further to $14.09. According to WEEX data, a single day saw $16.53 million of liquidations (including $13.68 million of short positions). Forced buy‑backs triggered a cascade of liquidations, OI jumped past $370 million, and daily trading volume was inflated to $9‑10 billion.
5. Exit strategy: After the price peaked, the manipulators turned to shorting and began large deposits to the CEX. Retail veterans saw the transfers and thought a dump was coming, so they shorted? Sorry, the manipulators squeezed this fresh wave of shorts once more before the actual dump, then cashed out.
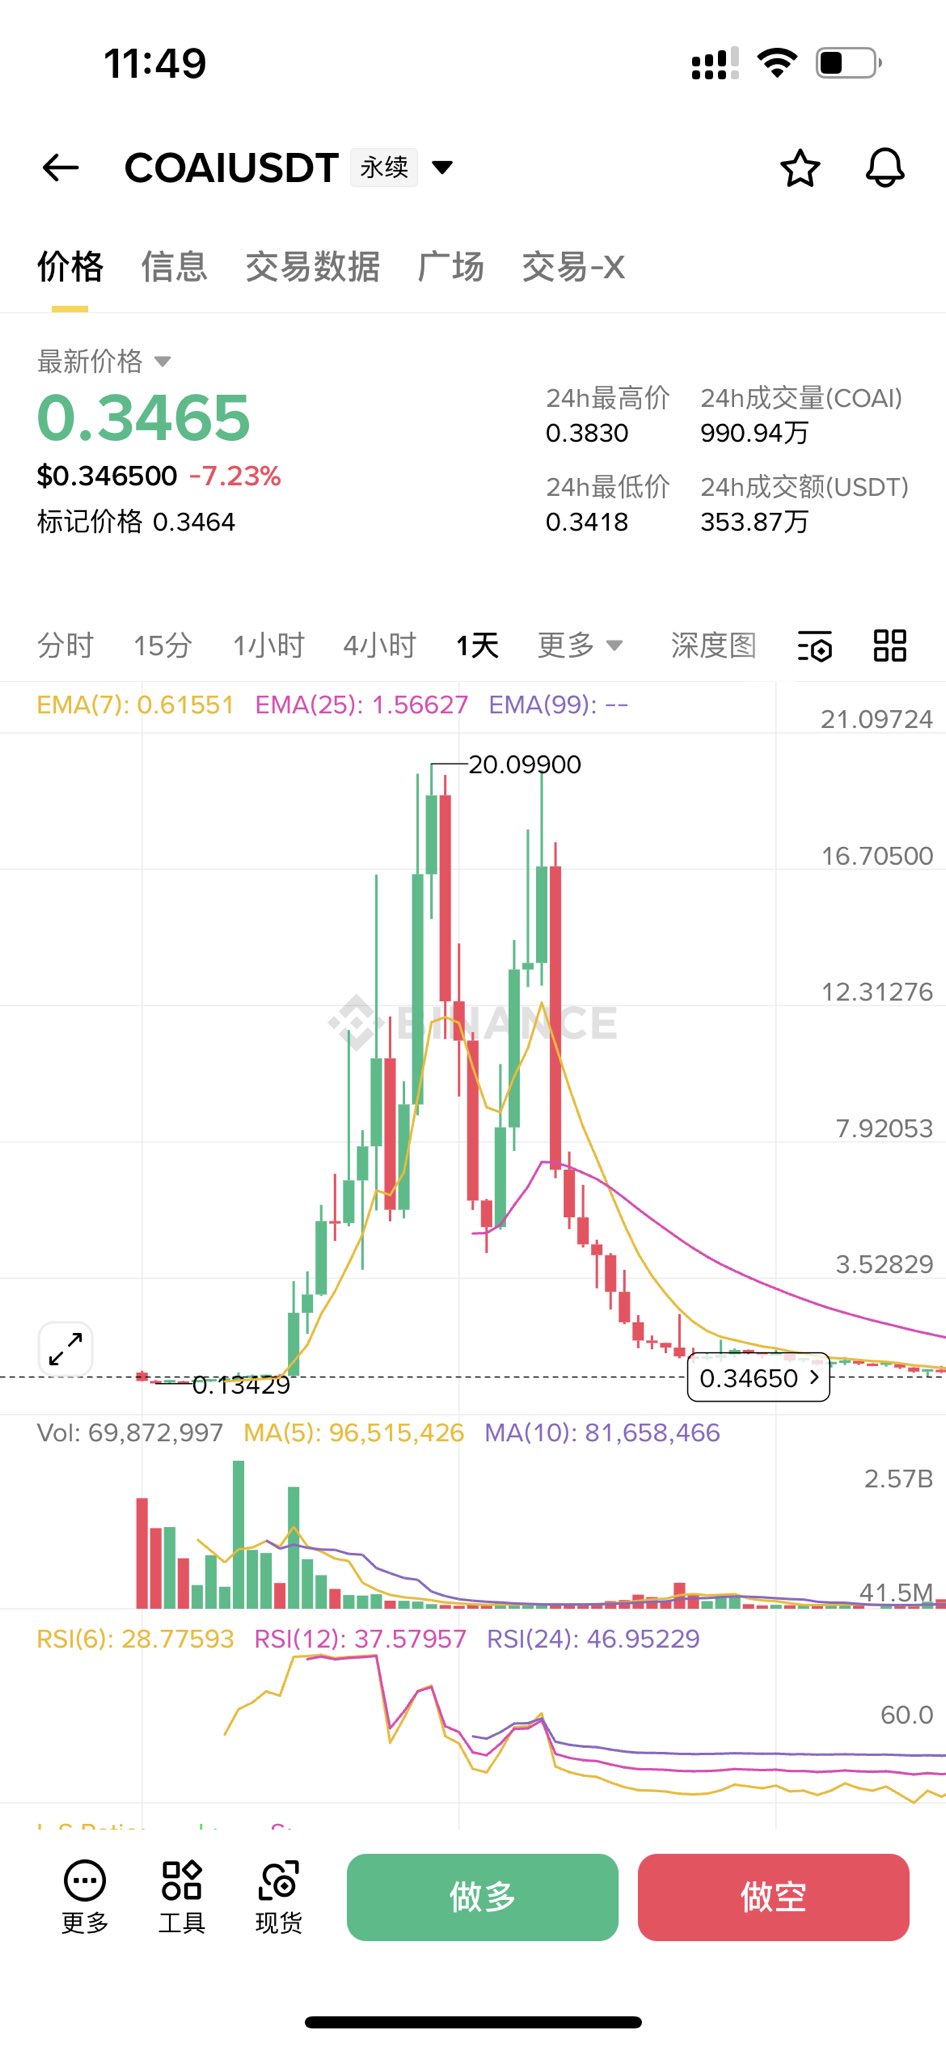
Script 2: Simple and brutal “pump‑and‑dump” (using COAI as an example)
Unlike MYX’s psychological warfare, COAI emphasizes “speed is the ultimate weapon”:
COAI launched in September 2025 at $0.22; after a week of consolidation, it listed on Aster on October 6 with 5× leverage, soaring from $0.39 to $2.42 in a single day.
Key data: On‑chain data shows 60 highly coordinated bot wallets that, on March 25 2025 at 11:00 UTC, received exactly 1 BNB of seed capital in the same second and executed synchronized purchases on the DEX.
Because only 24.86 % was unlocked at TGE (extremely low circulation), the manipulators used the “BNB Season” and “AI” narrative as cover; without needing to force a short squeeze, a few million dollars were enough to fully control the market, pushing the price to an internal ATH of $44‑45 within days, then dumping it, causing OI to plunge sharply.
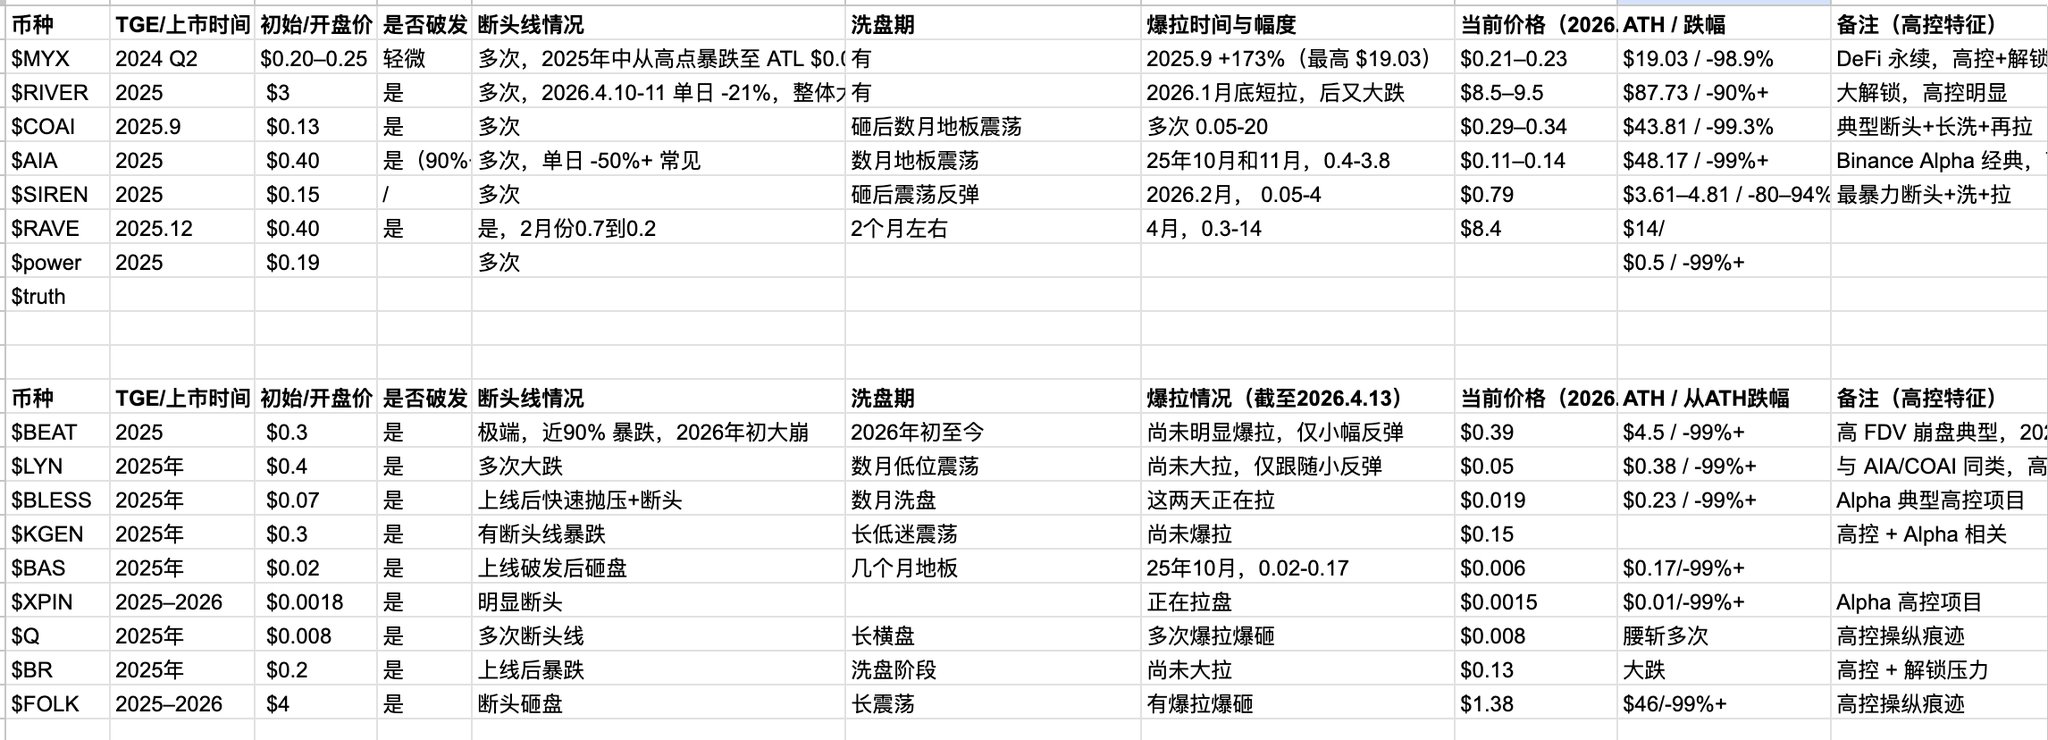
These tokens share astonishing common traits:
• Extremely low circulating supply: MYX unlocked only 9.21% at launch, COAI only 19.65%. On paper 20% appears to circulate, but in reality 95% is held by manipulators; without low‑float, the act cannot continue.
• Everything can be an AI narrative: most projects on the list (e.g., AIA, Rave) brand themselves as AI Agent infrastructure.
• Sequential token launch scheme: BNB Chain > Binance Alpha > Binance Futures. Listing futures is a killer move because leverage enables market makers to create liquidation waterfalls. Multi‑chain deployment also lets manipulators exploit cross‑chain bridges (e.g., Ronin Bridge pause) and weak liquidity for arbitrage manipulation.
Practical section: How to see through the micro‑lies of the order book?
Knowing the script isn’t enough; you need practical tools to catch manipulators, focusing on these core indicators and methodologies:
1. Spot “volume brushing” (OI Brushing)
Typical tokens have a volume/OI ratio of 3‑8×. During MYX’s squeeze, this ratio reached a terrifying 24×! Moreover, analysis shows that two‑thirds of MYX’s volume was concentrated on Bitget. Such an abnormal share on a single exchange is likely fabricated by the manipulators to create false hype.
2. Capture TWAP (Time‑Weighted Average Price) iceberg accumulation
Intelligent manipulators never place huge orders. They slowly consume sell orders near market price. You won’t see large orders, but you will notice:
• Sell‑side depth continuously thinning.
• Buy‑sell imbalance remaining above 0.4 for extended periods (formula: (Buy‑Volume‑Sell‑Volume)/(Buy+Sell)).
This means buy orders dominate ~70% of the book for a long time; manipulators proportionally add buy orders, nudging the buy‑sell ratio from 0.95 to 0.99, appearing normal while they voraciously accumulate tokens!
Geek tactic: run a Python script every 60 seconds to fetch Binance futures depth and store it in SQLite, enabling monitoring of such anomalies.
4. Cross‑exchange manipulation
Binance’s mark price (which determines liquidation) is a weighted average across multiple exchanges. Manipulators can, with minimal capital, push the price on shallow second‑tier venues like Aster or Bitunix, raising Binance’s mark price to trigger liquidations, and even execute delta‑neutral hedges (long on Binance, short on Aster). When a token has no spot activity but appears on both second‑tier and Binance futures, it should be blacklisted!
Five fatal signals:
1. Funding rate: Persistent negative = plenty of “fuel,” short squeeze continues; moving toward zero = shorts capitulate, squeeze ending; flipping positive = shorts wiped out, longs start paying, likely a downtrend.
2. OI vs price: both rising = new shorts walking into a death trap; OI falling while price stable = liquidation buying weakening; price falling while OI rises = manipulators have turned short.
3. Taker Ratio: buyer‑dominated = short squeeze ongoing, balance = about to end; seller‑dominated for many hours = manipulators distributing remaining tokens to the last buyers.
4. Large on‑chain transfers: during a short squeeze there are no big transfers. Once a large wallet starts moving massive funds to a CEX, expect an imminent dump.
Toolbox:
• CoinAnk: the ultimate radar for cross‑exchange OI distribution, funding rates, and liquidation data (best single dashboard).
• Arkham & Bubblemaps: investigate on‑chain front‑running and wallet clusters.
• Coinglass: essential for daily OI and volume monitoring.
In this heavily manipulated dark forest, our only advantage is to understand the script beforehand and use tools to anticipate the manipulators’ moves.
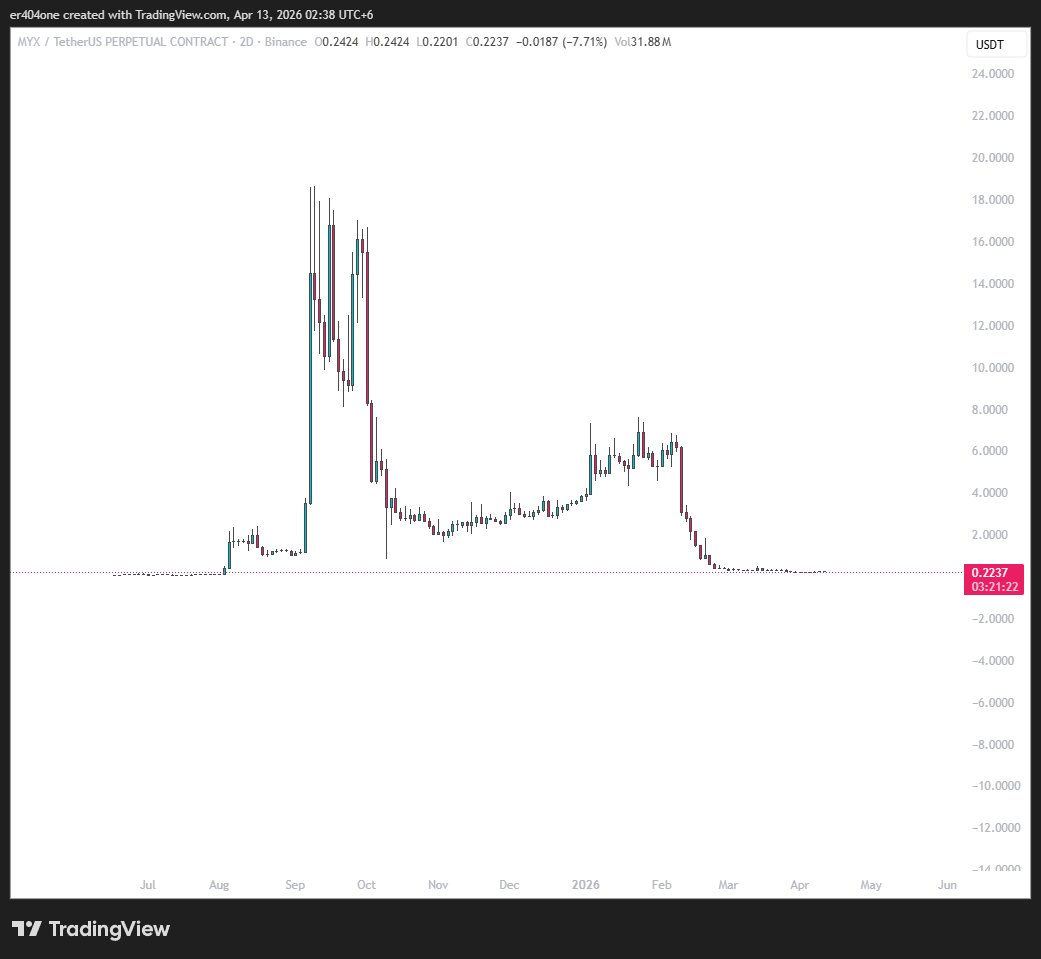
 MYX Finance (MYX)
 onchainschool.pro OnChain_Analyst Educator C7.30K @how2onchain
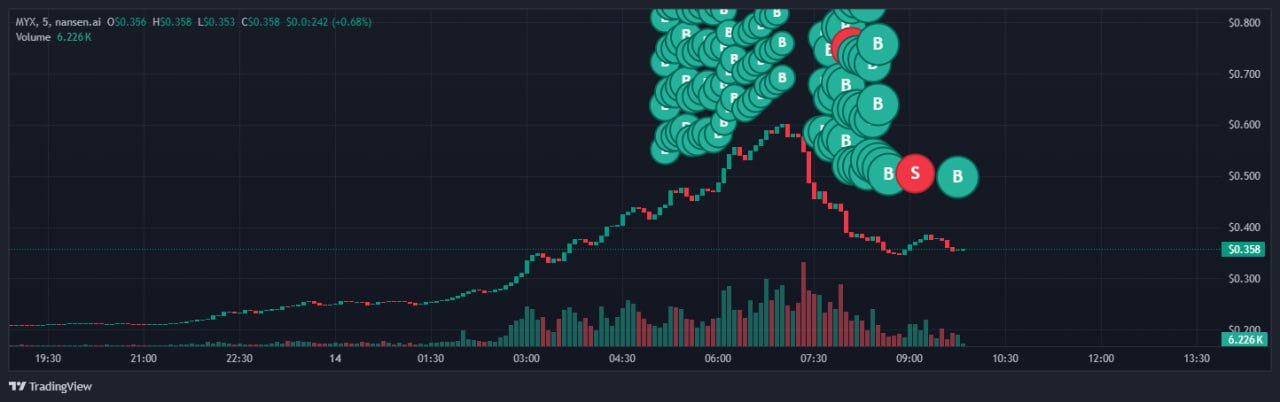
 ERROR TA_Analyst Trader A10.47K @ER404i
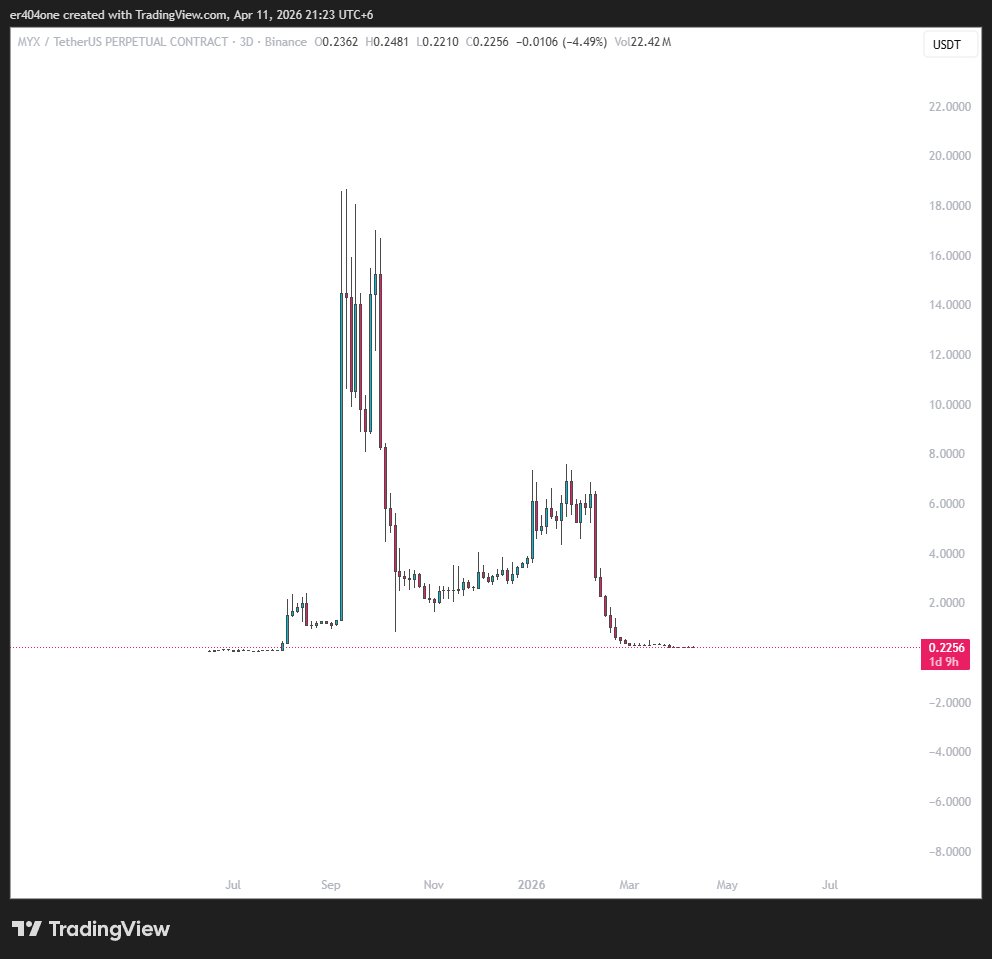
 VIKTOR Trader Educator B60.92K @thedefivillain
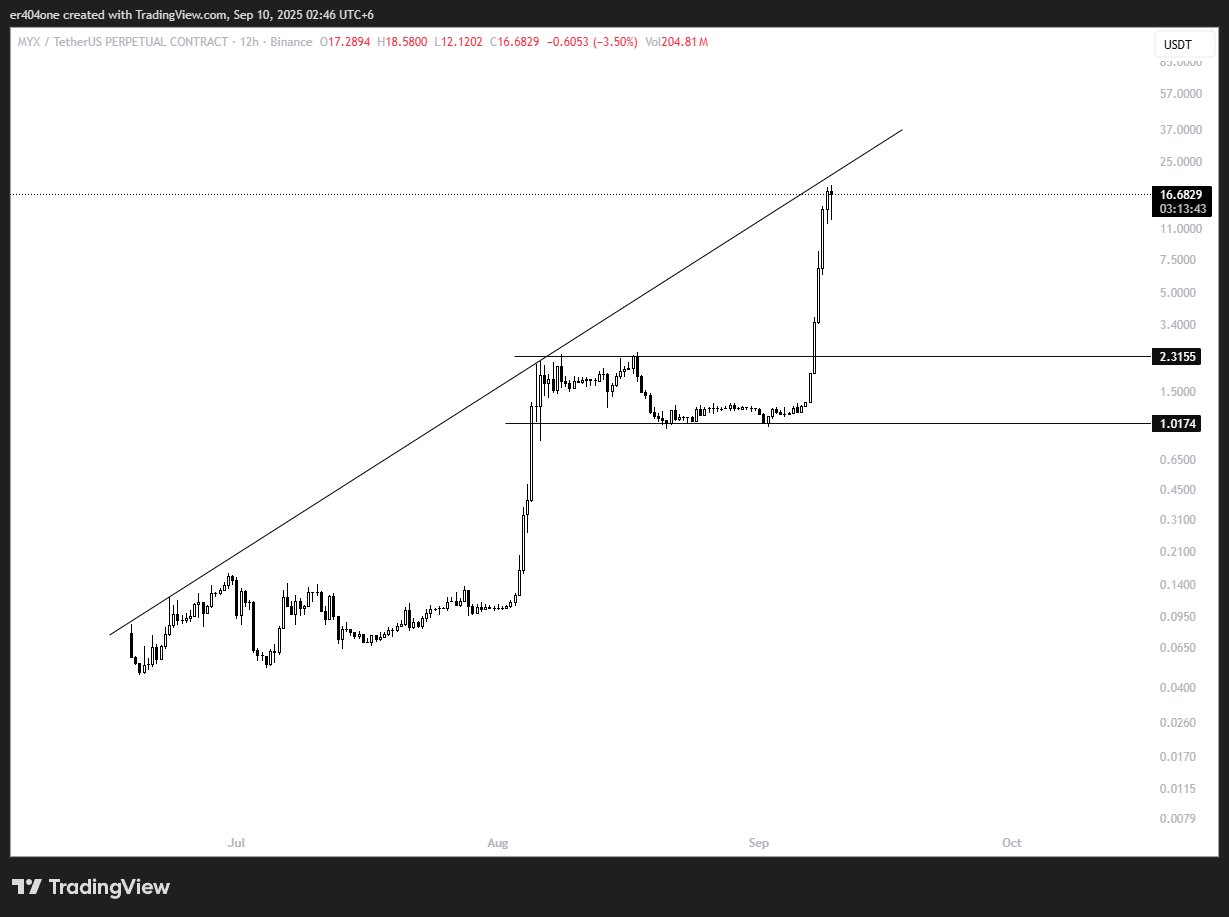 25 0 2.87K Ler original >Tendência de MYX após o lançamentoExtremamente Bearish