
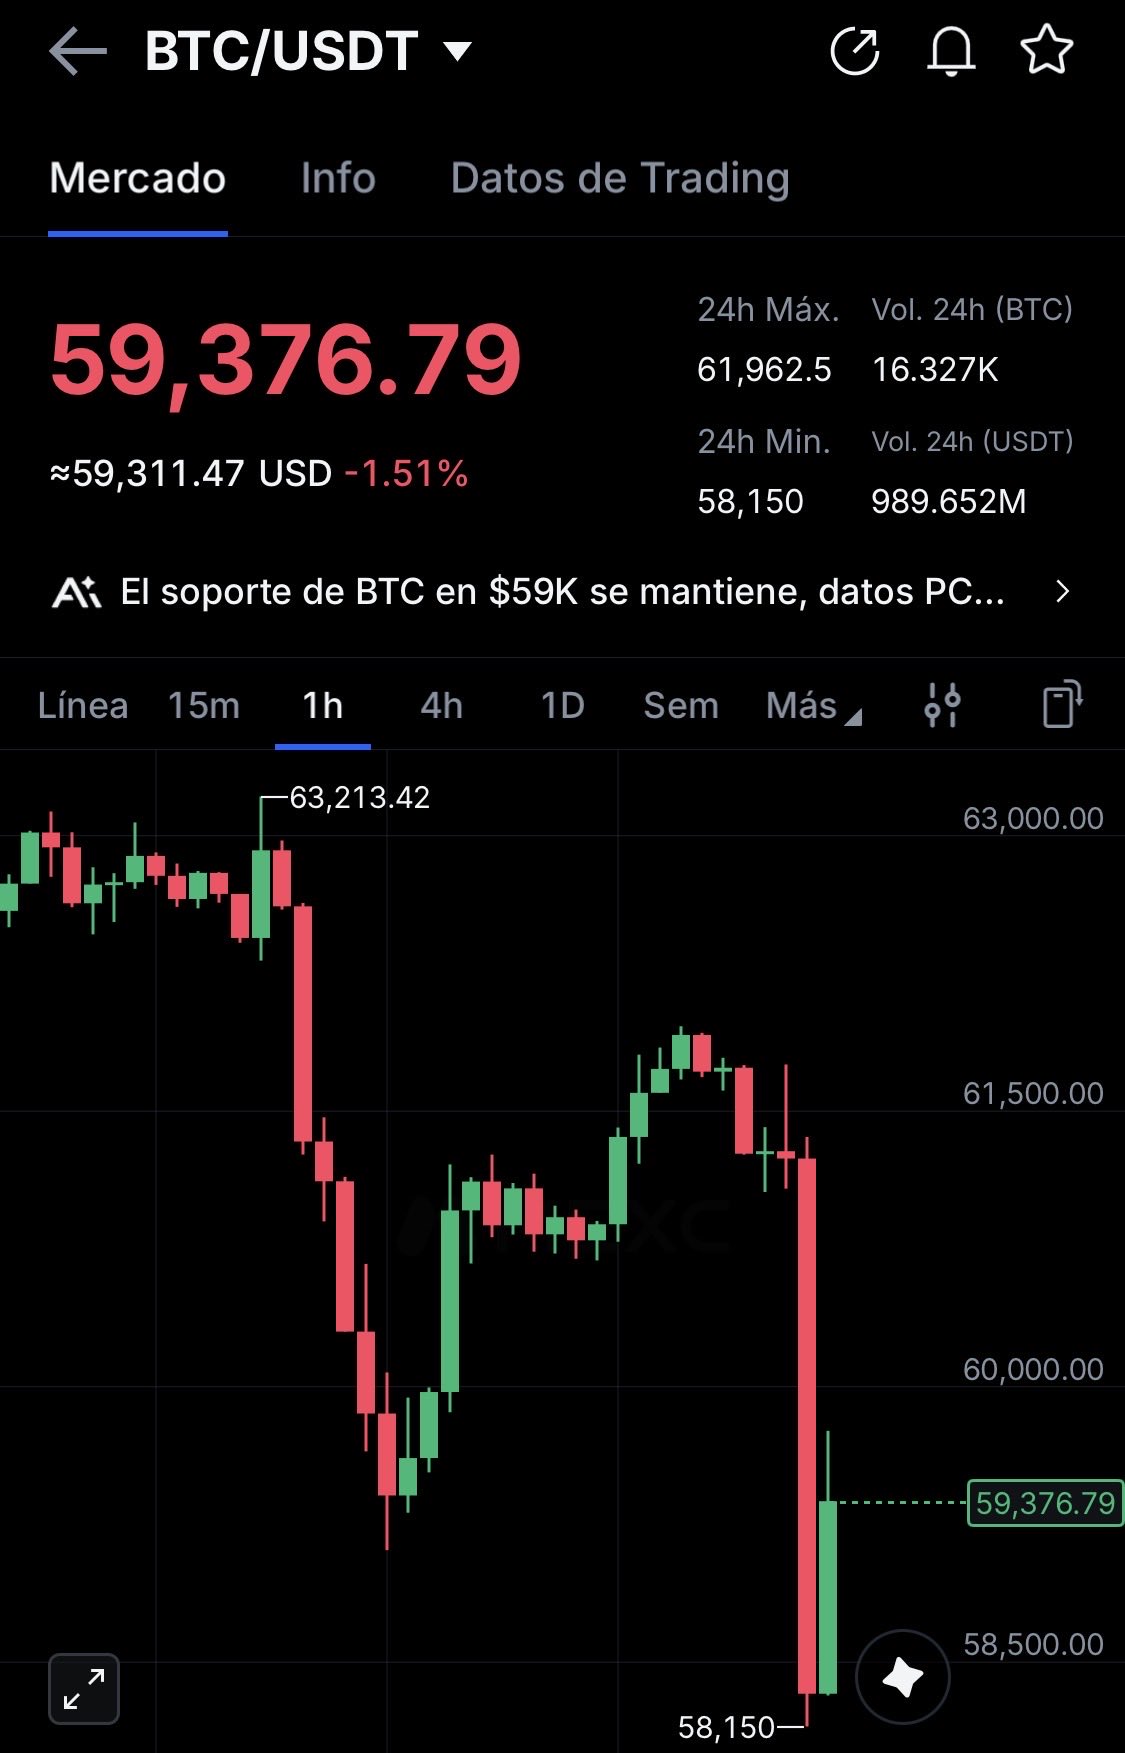
🚨PRICE ALERT🚨
Bitcoin just took a tumble below 59k 👀‼️ https://t.co/pHMXTY2TVB


 310.3K @healthy_pockets
 🚨PRICE ALERT🚨
Bitcoin just took a tumble below 59k 👀‼️ https://t.co/pHMXTY2TVB
 3
3
 0
0
 1.3K
1.3K
 233.0K @StackerSatoshi
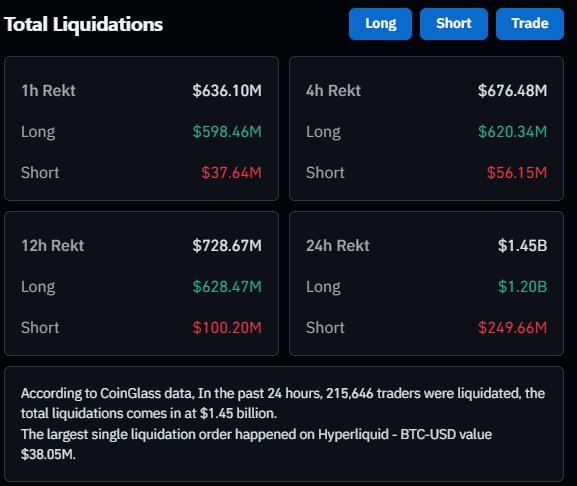
 That was a HUGE liquidation cascade to start the US session with $600M of longs liquidated in a single hour and $1.2B of longs rekt over the past 24 hours. https://t.co/tpZuAZDgLa
 4
0
3.3K
4
0
3.3K
 1.4M @BSCNews
 Over $450 million in leveraged long positions were liquidated in just 60 minutes as Bitcoin fell below $60k...
Rekt June?
 4.2M @WatcherGuru
 JUST IN: $500,000,000 liquidated from the crypto market in the past 60 minutes. https://t.co/ZVQfGyqCAq
 4
0
6.3K
4
0
6.3K


