Iniciar
Escanear para Baixar o Aplicativo
IOS e Android
BitMart / Cripto / NBIS

Nebius Group NV (Derivatives) (NBIS)

$
$ 240.40 (NBIS/USD)
-5.58%
24H

Nebius Group NV (Derivatives) NBIS Histórico de Preços USD

Acompanhe o preço de Nebius Group NV (Derivatives) hoje e nos últimos 7, 30 e 90 dias
Período
Mudar
Alterar (%)
Hoje
$ 14.32
-5.58%
7Dias
$ 29.47
-10.34%
30Dias
$ 20.15
8.56%
90Dias
$ 20.15
8.56%

Adquira NBIS agora

Compre e venda NBIS de forma fácil e segura na BitMart.
Compre/Venda NBIS agora
Compre/Venda {0} agora
Nebius Group NV (Derivatives) Informações de mercado
Último preço $ 242.09
$ 236.39 Intervalo de 24h $ 257.72
Máximo histórico
‎$ 297.54‎
Mínimo histórico
‎$ 201.07‎
Alteração 24h
‎-5.58%‎
24h Vol
‎$ 0‎
Fornecimento circulante
0.00 NBIS
Capitalização de mercado
‎$ 0‎
Fornecimento máximo
--
Capitalização de mercado totalmente diluída
‎$ 0‎
Comércio NBIS

Ganhar

Coloque suas criptomoedas ociosas para trabalhar e ganhe renda passiva com poupança, staking e muito mais.
Experimente Agora
Experimente Agora

Nebius Group NV (Derivatives) X Insight

avatar
The author purchased NBIS and lost nearly $20,000, seeking help and monitoring its listing on Binance Wallet.

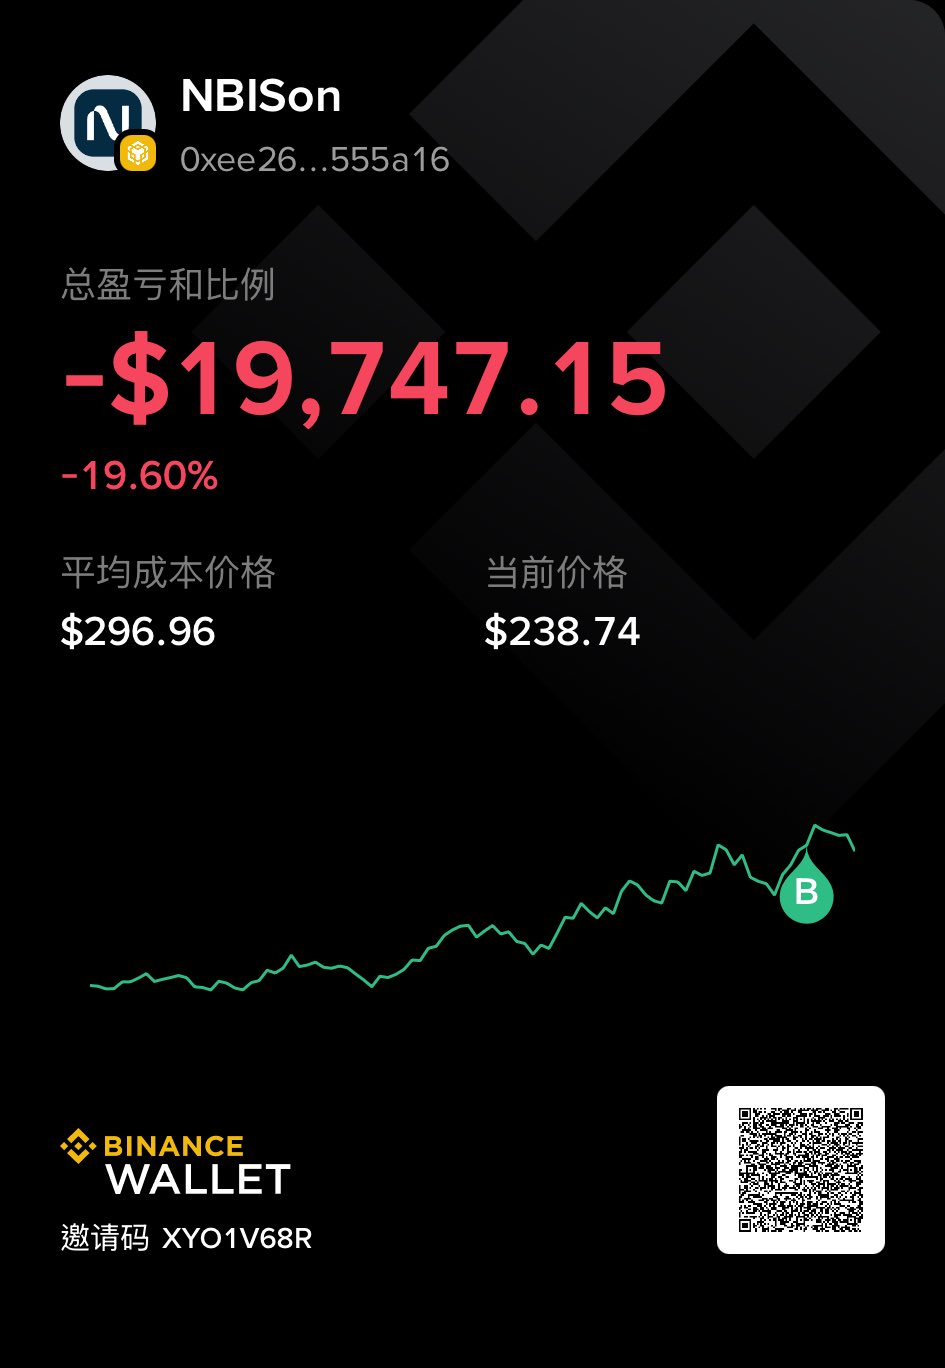
Bought $NBIS lost 2wu, help! https://t.co/sPZa2FFBee

avatar

Bought 10wu of NeoCloud leader $NBIS to test the waters.
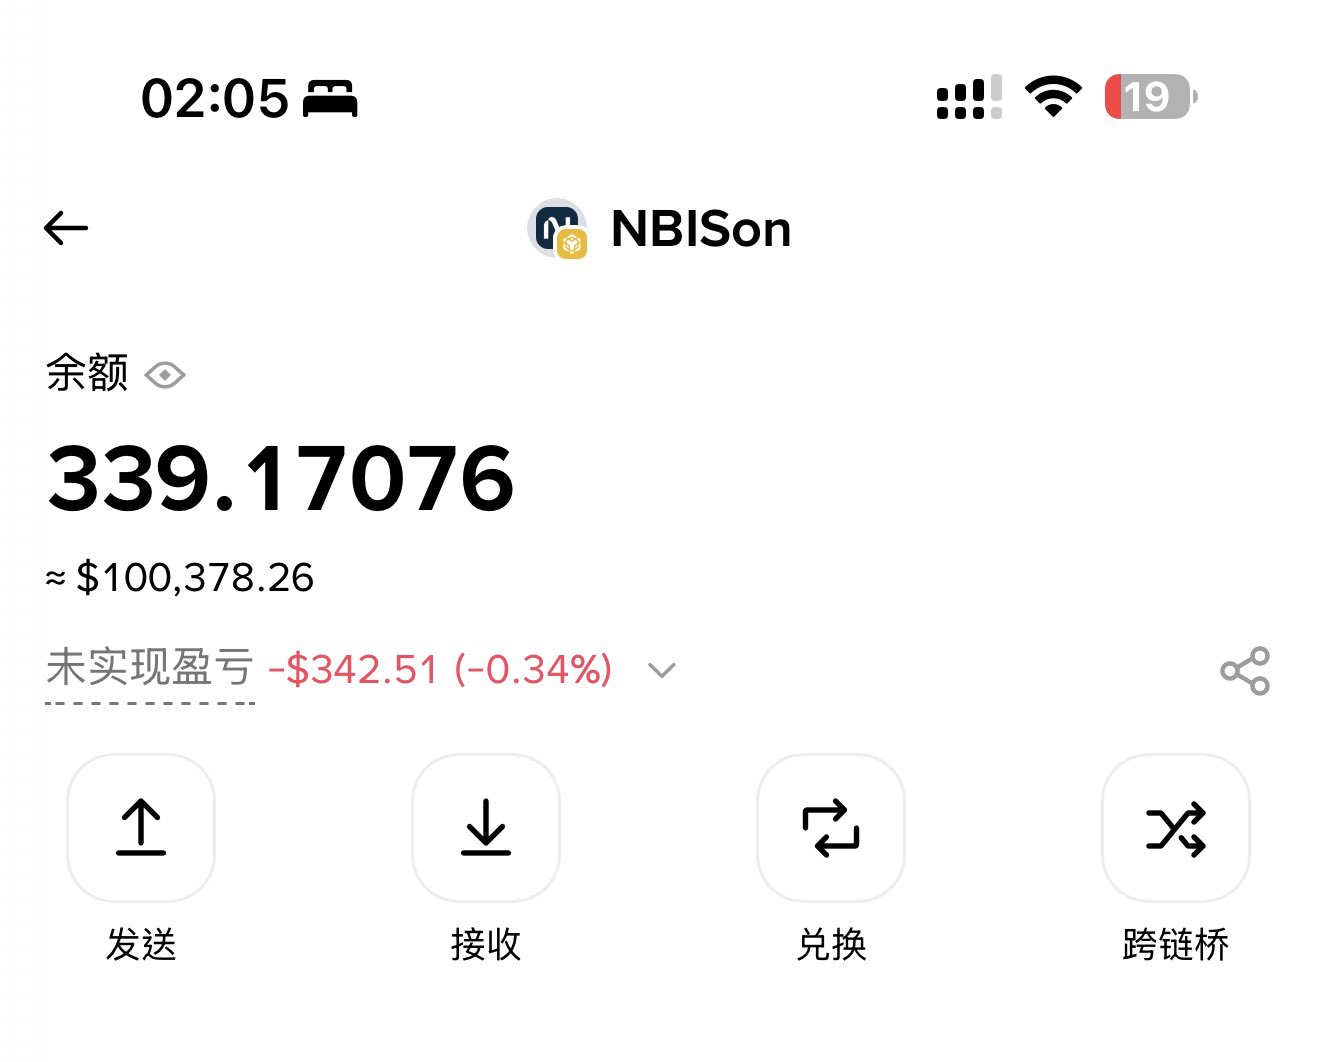
Couldn't find the bStock version of $NBIS in Binance Wallet, only found the Ondo one, not sure when it will be listed?
@BinanceWallet @binance @heyibinance @cz_binance https://t.co/tIOkWli1O2

view 14
view 23
view 9.3K
2026-06-26 15:37
Tendência de NBIS após o lançamento
Extremamente Bearish
The author purchased NBIS and lost nearly $20,000, seeking help and monitoring its listing on Binance Wallet.
avatar
Inquiry about NBIS target price after breaking the 300 resistance

Can someone smarter than me on TA tell me whats the target if we break the 300 resistance on $NBIS?

view 31
view 11
view 13.9K
2026-06-25 18:37
Tendência de NBIS após o lançamento
Neutro
Inquiry about NBIS target price after breaking the 300 resistance
avatar
NBIS surged strongly to $270 after forming a double bottom.
avatar

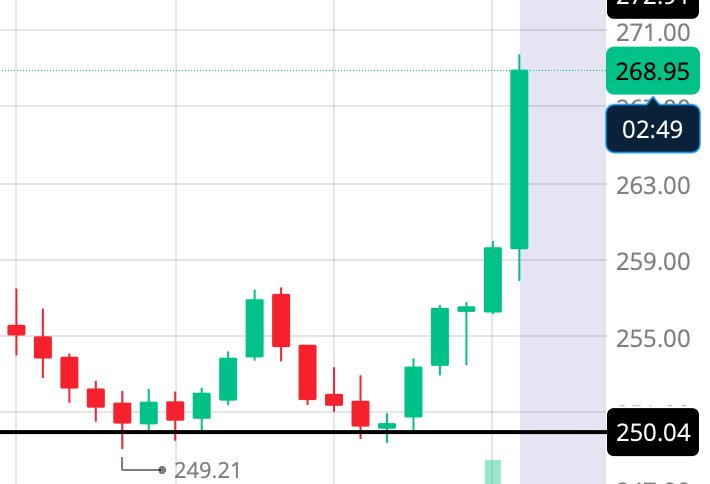
$NBIS pushing $270 after hours, after a nice, intra-day double bottom off $250 which I shared earlier.. https://t.co/2pqsrtTVQW

view 68
view 6
view 12.9K
2026-06-24 23:27
Tendência de NBIS após o lançamento
Extremamente Bullish
NBIS surged strongly to $270 after forming a double bottom.
Detalhes

Previsão de preço

Quando é um bom momento para comprar NBIS? Devo comprar ou vender NBIS agora?

Ao decidir se é um bom momento para comprar ou vender Nebius Group NV (Derivatives) (NBIS), é importante primeiro se alinhar à sua própria estratégia de trading e perfil de risco. Investidores de longo prazo e traders de curto prazo geralmente interpretam as condições de mercado de forma diferente, então sua decisão deve refletir a sua abordagem pessoal. De acordo com a análise técnica de 4 horas mais recente de NBIS, o sinal de trading atual é Hold.
57
Hold
Análise técnica de 4 horas de NBIS
Última Atualização 2026-06-26 15:59:59
beacon

Previsão do Beacon

Previsão Probabilística de Preço (Próximas 24 horas)
i
Aviso de Isenção de Responsabilidade de Previsões do Beacon
Os resultados dos dados exibidos nesta página são analisados com base em dados de negociação reais (OHLCV) do par de trading selecionado, juntamente com indicadores técnicos correspondentes.
Esta previsão é um produto técnico experimental, fornecida apenas para fins de referência. Ela não constitui uma orientação de investimento. Eventos inesperados no mundo real podem afetar significativamente o comportamento do mercado. Os traders devem tomar decisões com cautela.
Sobre Nebius Group NV (Derivatives)
Nebius Group NV (Derivatives) (NBIS) is a cryptocurrency . Nebius Group NV (Derivatives) has a current supply of 0. The last known price of Nebius Group NV (Derivatives) is 284.53963262 USD and is down -1.01 over the last 24 hours. It is currently trading on 42 active market(s) with $0.00 traded over the last 24 hours.
Leia mais