Iniciar
Escanear para Baixar o Aplicativo
IOS e Android
BitMart / Cripto / VVV

Venice Token (VVV)

$
$ 14.50 (VVV/USD)
1.75%
24H

Venice Token Dados de preços ao vivo

O preço atual de Venice Token é $ 14.50 (VVV/USD). Com um Market Cap de $ 681.51M USD, Volume de Trading em 24 horas de $ 19.33M USD, Uma Variação de Preço em 24 horas de +1.75%, E um Fornecimento Circulante de 46.99M VVV.

Venice Token VVV Histórico de Preços USD

Acompanhe o preço de Venice Token hoje e nos últimos 7, 30 e 90 dias
Período
Mudar
Alterar (%)
Hoje
$ 0.24
1.75%
7Dias
$ 0.049
0.35%
30Dias
$ 1.70
-10.61%
90Dias
$ 8.50
146.47%

Adquira VVV agora

Compre e venda VVV de forma fácil e segura na BitMart.
Compre/Venda VVV agora
Compre/Venda {0} agora
Venice Token Informações de mercado
Último preço $ 14.50
$ 14.04 Intervalo de 24h $ 14.94
Máximo histórico
‎$ 21.36‎
Mínimo histórico
‎$ 0.91‎
Alteração 24h
‎1.75%‎
24h Vol
‎$ 19,331,491.71‎
Fornecimento circulante
46.98M VVV
Capitalização de mercado
‎$ 681.51M‎
Fornecimento máximo
--
Capitalização de mercado totalmente diluída
‎$ 1.17B‎
Comércio VVV

Ganhar

Coloque suas criptomoedas ociosas para trabalhar e ganhe renda passiva com poupança, staking e muito mais.
Experimente Agora
Experimente Agora

Venice Token X Insight

avatar
VVV's technical structure shows weakness, having formed a lower low, awaiting confirmation of a downtrend.

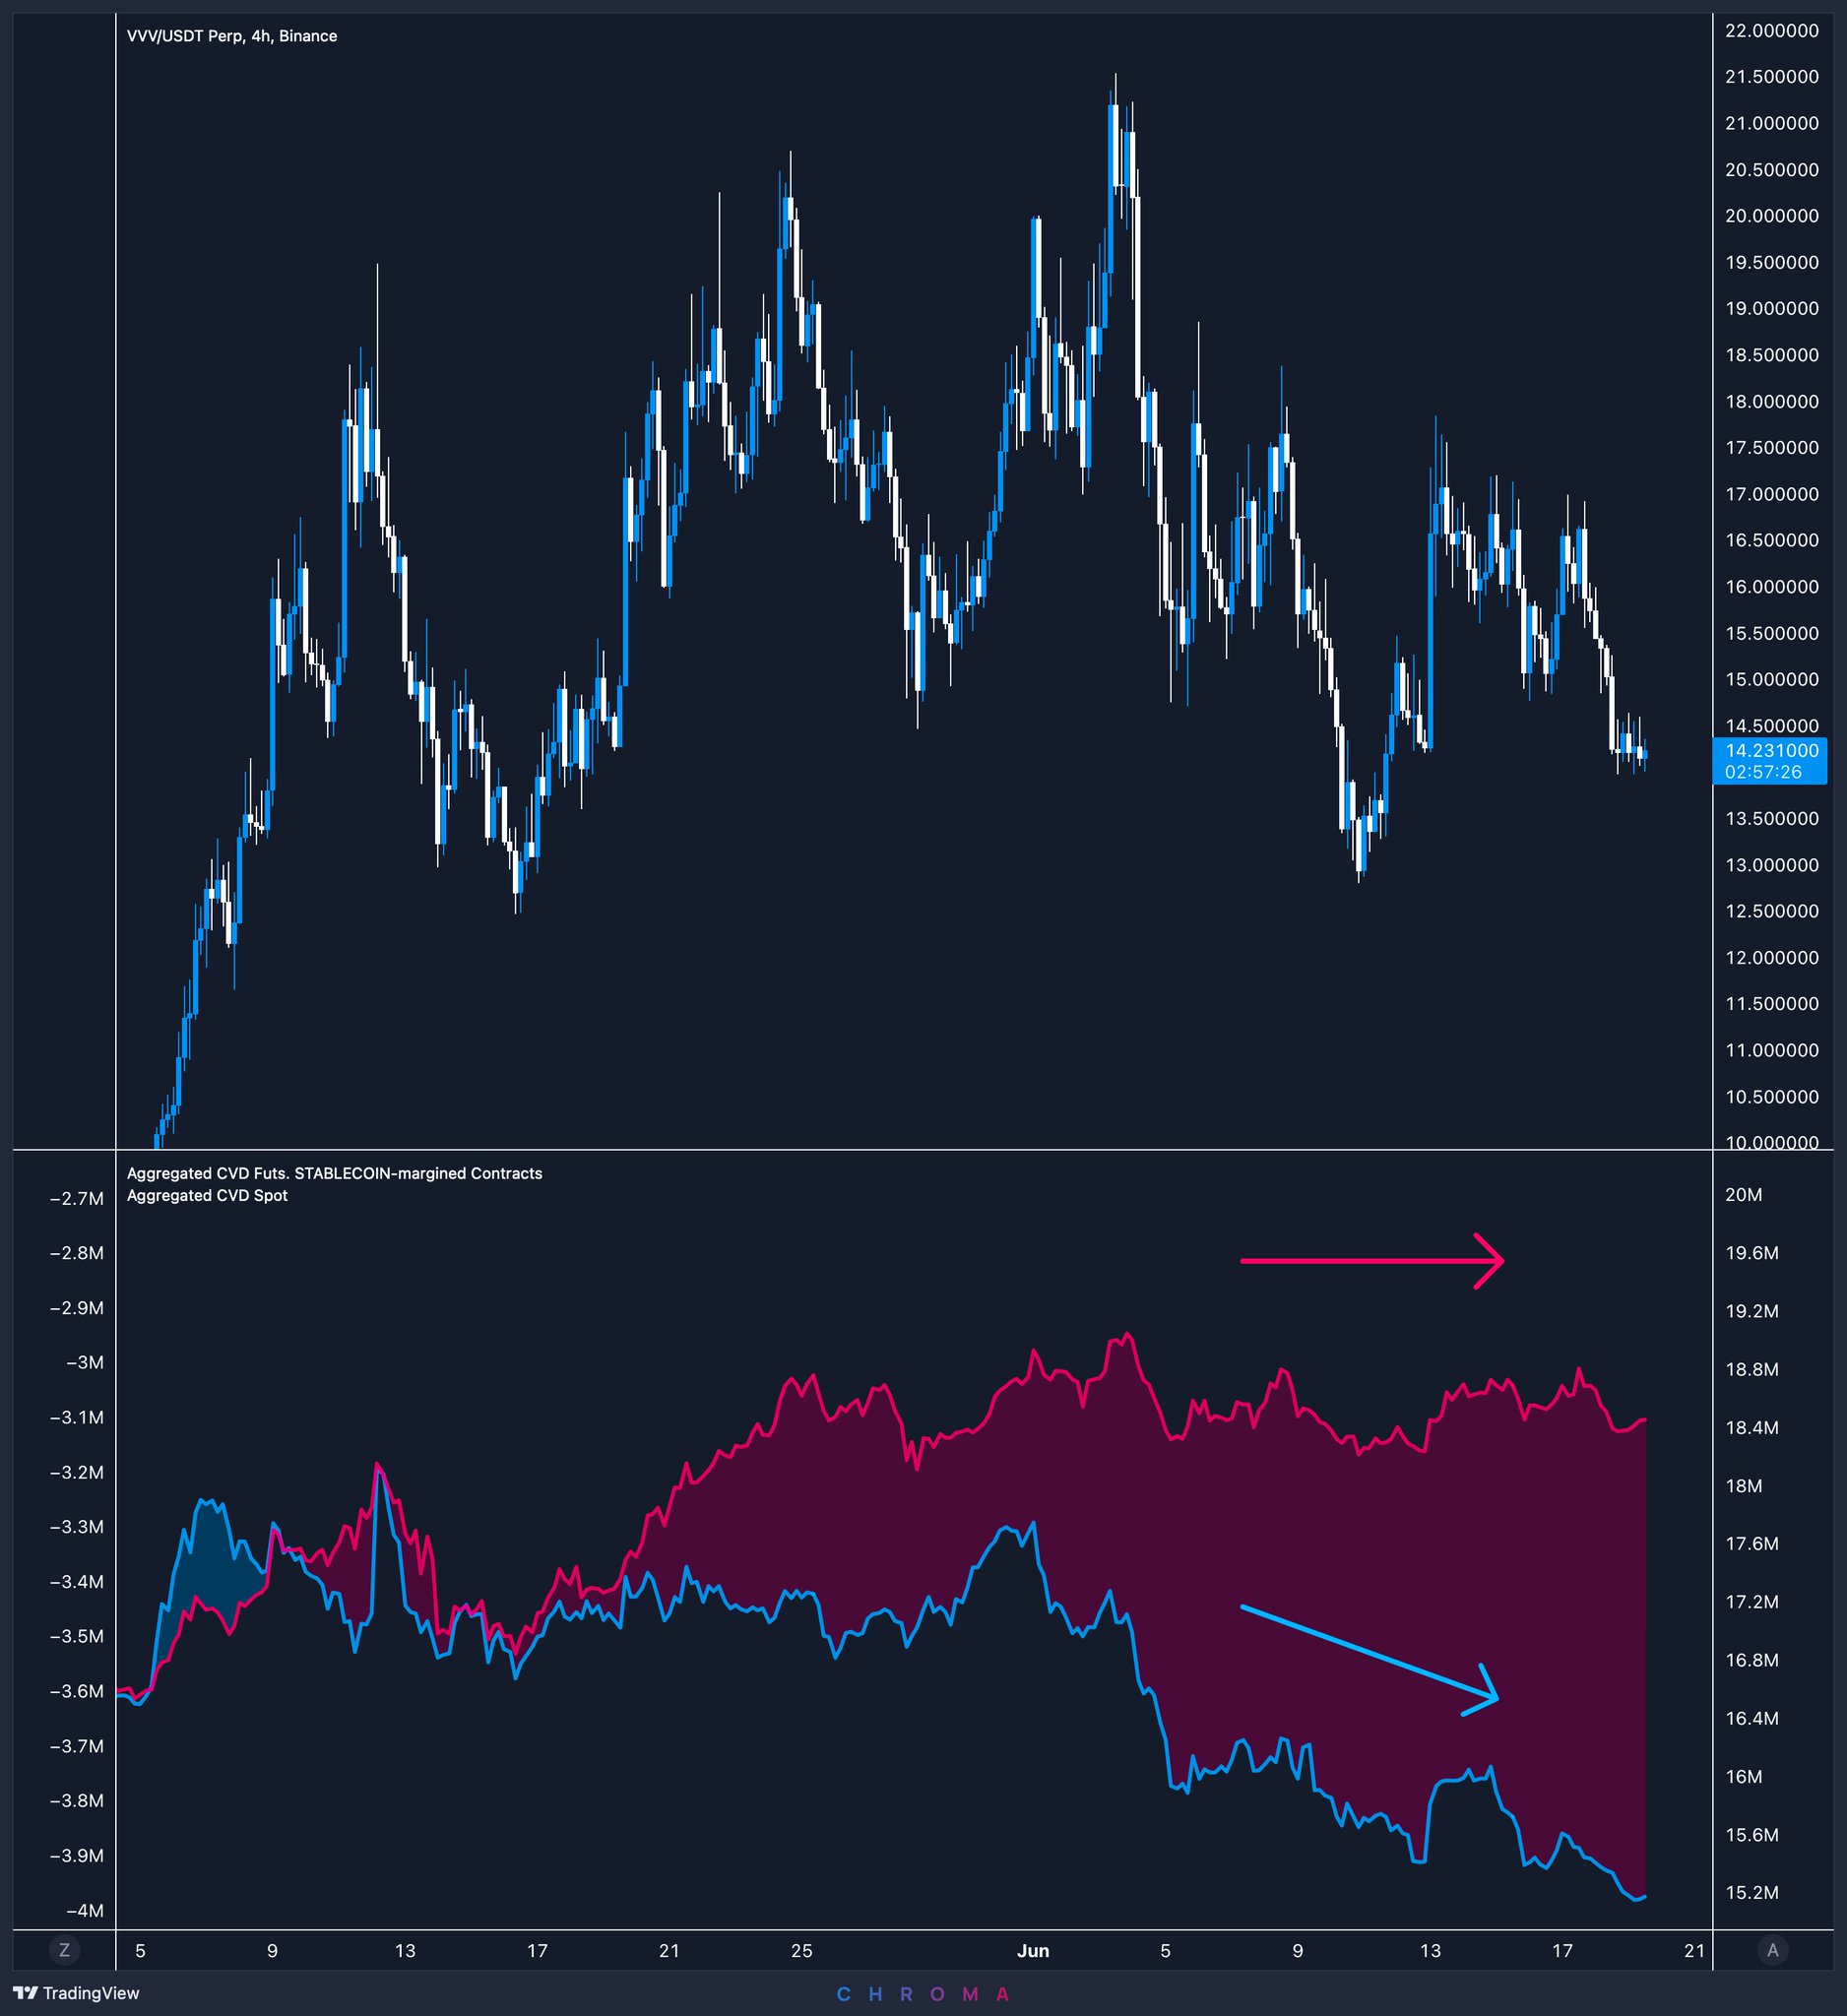
This is my current observation of #Venice Token $VVV, starting with the four-hour timeframe.

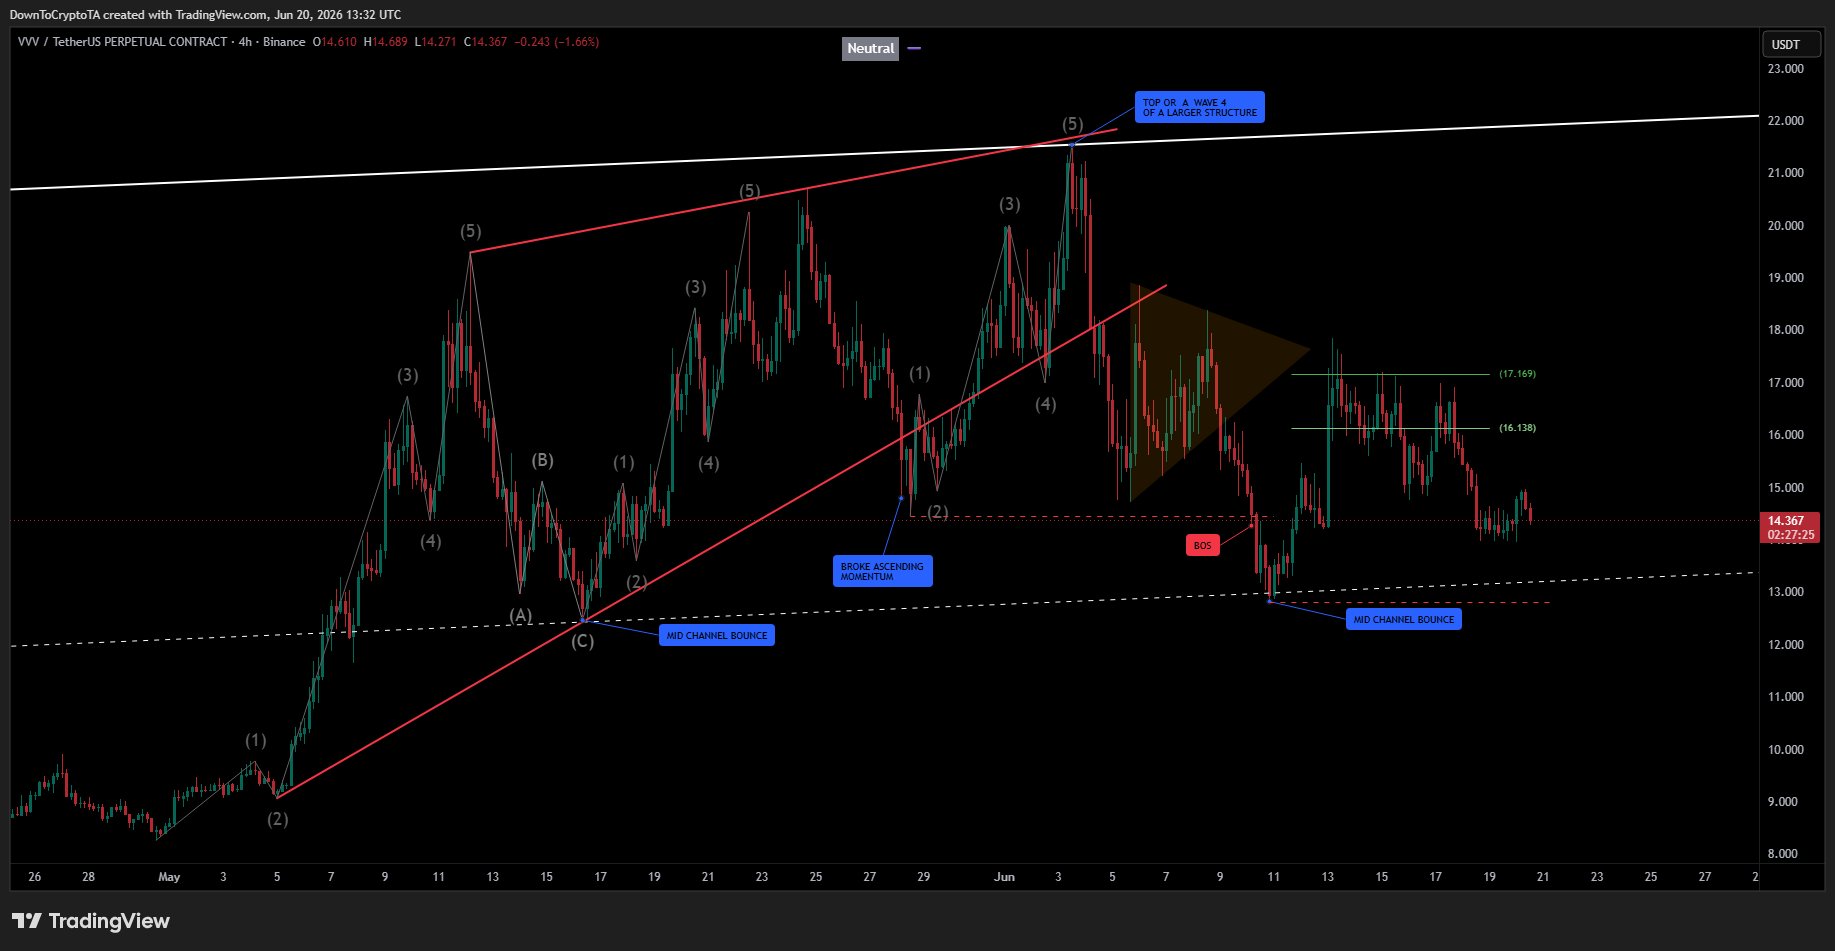
On May 28th, VVV broke its ascending momentum structure to the downside from what appeared to be a bearish rising wedge formation. Following that breakdown, price managed a reclaim and proceeded to put in what looked like a five-wave impulsive move to the upside. However, despite completing that advance, price only marginally exceeded the prior high before running into significant resistance and reversing lower.

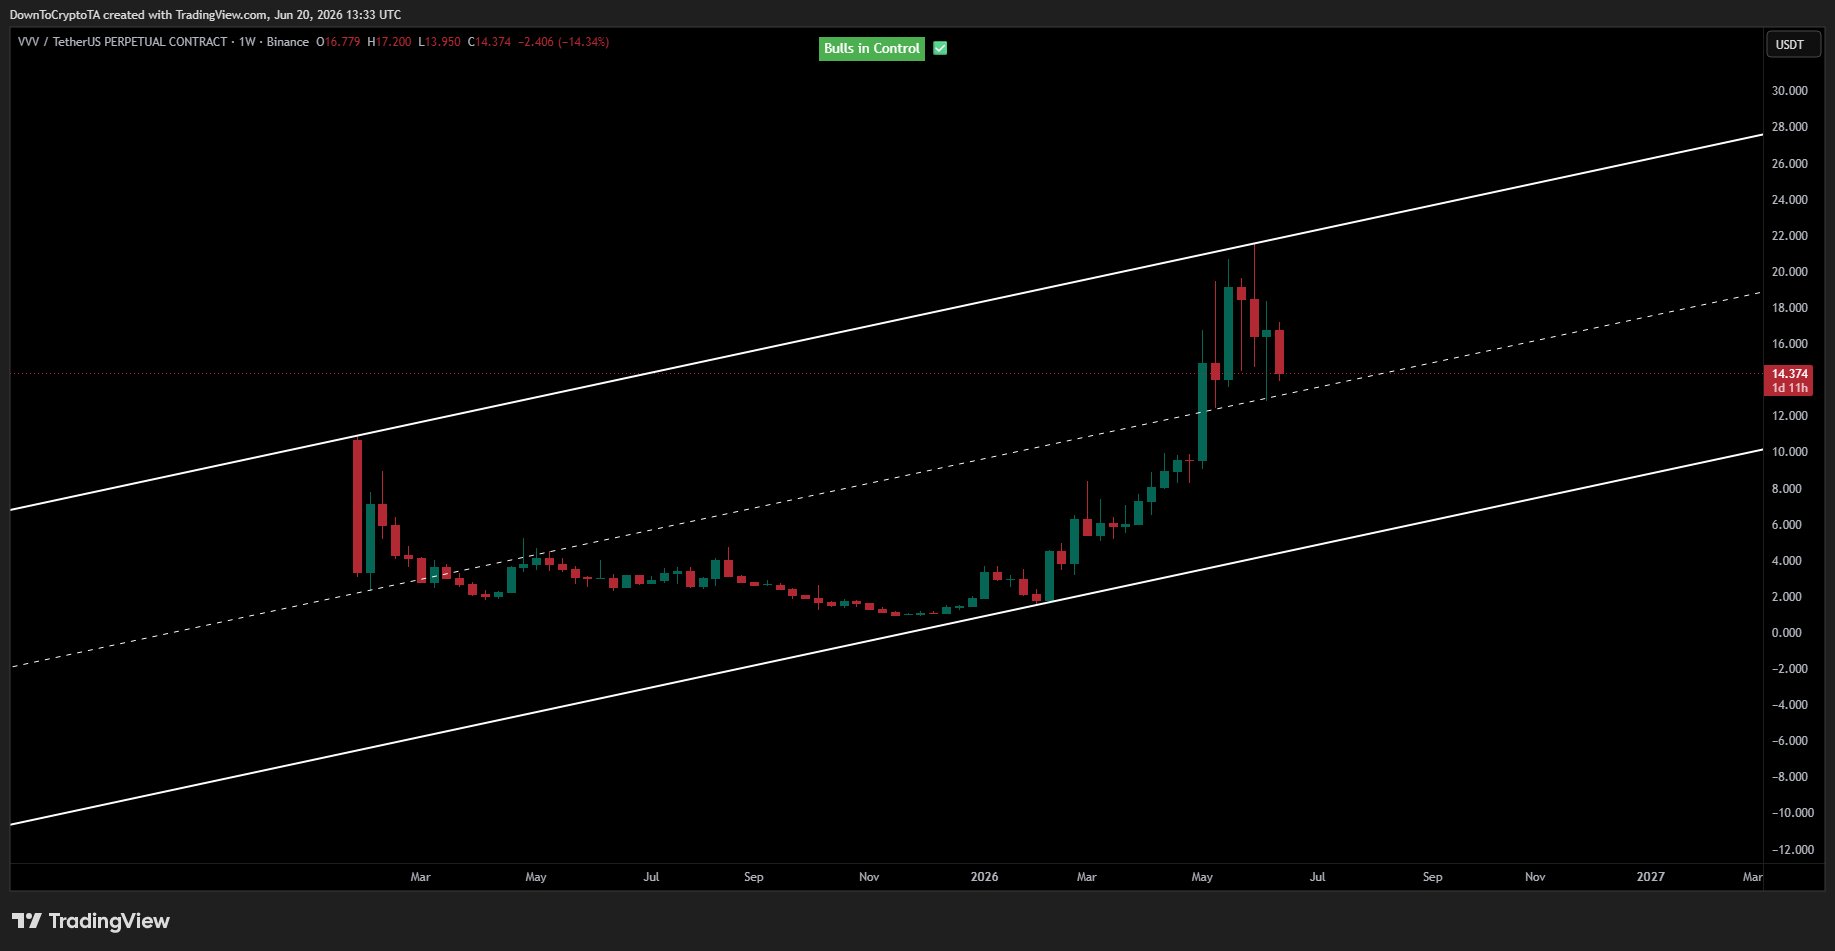
What makes this development particularly interesting is that the breakdown of the four-hour trendline coincided with a break of the weekly RSI trend regression line. When multiple timeframes begin signaling weakness simultaneously, it increases the probability that a larger trend shift may be developing beneath the surface.

Since putting in the local high, price has now broken market structure to the downside. We have successfully established a lower low, which is the first requirement for a potential trend reversal. However, the bearish structure is not yet fully confirmed.

At this point, we have one lower low in place, but we have not established a confirmed lower high. More importantly, we do not yet have a secondary lower low following that potential lower high. Until those pieces are formed, the market remains in a transition phase rather than a confirmed downtrend.

For now, the key area to watch is the next rally attempt. If price fails to reclaim the highs and instead forms a lower high before breaking down again, that would provide much stronger evidence that a larger bearish trend is beginning to emerge. Until then, caution is warranted, as the current structure suggests weakness but has not yet completed the sequence necessary to fully confirm a trend reversal.

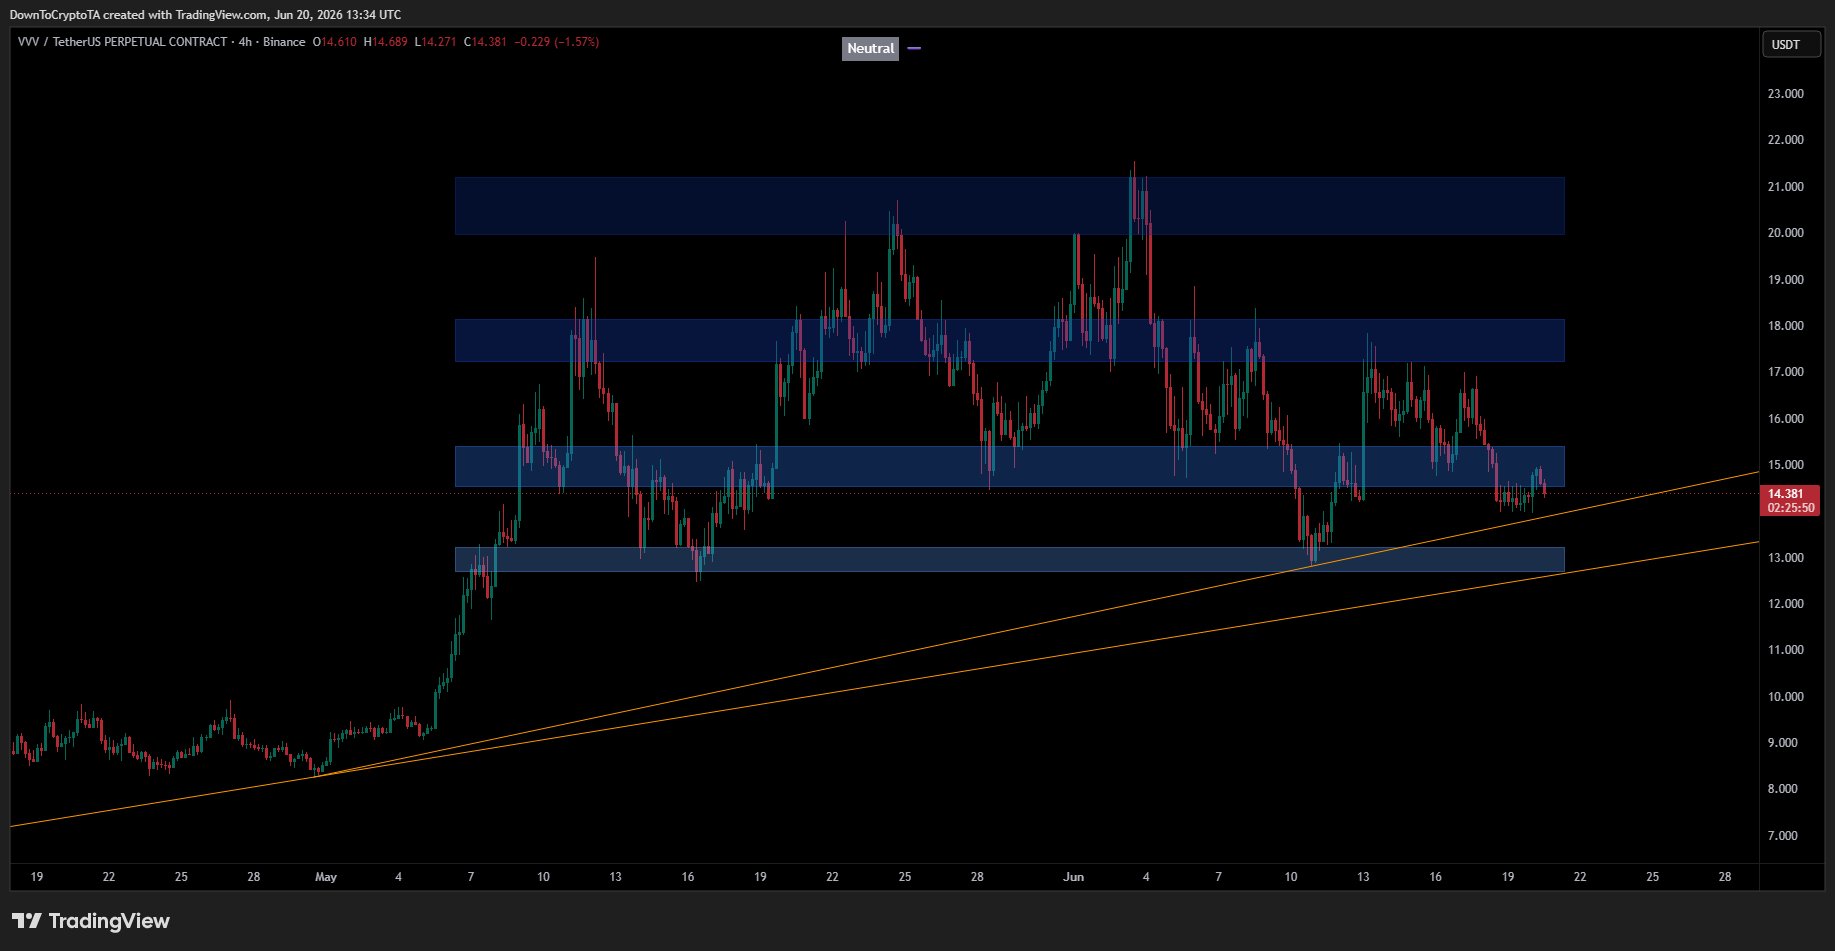
I am now able to connect both of the major highs along with the pivot low, allowing me to construct a channel structure. After applying the midpoint of that channel, it's become clear that price is currently respecting it as a key area of interest.

At the moment, this doesn't necessarily provide a directional signal on its own, but it does suggest that price could eventually retrace much deeper within the channel. If the structure continues to play out, there is a possibility that price action works its way all the way back down toward the lower boundary of the channel over time.

Another important observation is the second pivot low, which currently aligns closely with the channel midpoint. If that level breaks, it would establish a second lower low and provide confirmation of a Change of Character (ChoCH). That would significantly strengthen the bearish case and increase the probability that a larger corrective phase is underway.

The other scenario I'm attempting to evaluate is whether VVV is developing a larger Wave 4 correction from a macro perspective. If that interpretation is correct, then there could still be one final push higher to take out the current local high before the market experiences a more meaningful rollover. At this stage, I don't have enough confirmation to fully commit to that outlook, so it's something I'll continue monitoring as price action develops.

For now, my focus remains on the structure. If we do put in that second lower low and confirm the Change of Character, then I'll begin looking for a larger mean reversion move on the weekly timeframe.

Currently, that weekly mean reversion level sits around $9.68, which would become a logical area of interest should the bearish structure continue to develop and gain confirmation.

view 0
view 0
view 62
2026-06-20 13:57
Tendência de VVV após o lançamento
Baixista
VVV's technical structure shows weakness, having formed a lower low, awaiting confirmation of a downtrend.
avatar
VVV is seen as a privacy-oriented GPT wrapper, outlook unclear

$VVV seems like a GPT wrapper to me, basically Ai16z but for… privacy instead of agents… ??

view 28
view 9
view 4.4K
2026-06-20 10:07
Tendência de VVV após o lançamento
Neutro
VVV is seen as a privacy-oriented GPT wrapper, outlook unclear
avatar
VVV shows distribution signs at high levels, expecting the price to drop in Q3.
avatar

Textbook distribution at the highs

Spot selling, perps longing

Lower prices in Q3

Bookmark this

$VVV https://t.co/jf34CQj37f

view 258
view 15
view 21.1K
2026-06-20 09:17
Tendência de VVV após o lançamento
Extremamente Bearish
VVV shows distribution signs at high levels, expecting the price to drop in Q3.
Detalhes

Previsão de preço

Quando é um bom momento para comprar VVV? Devo comprar ou vender VVV agora?

Ao decidir se é um bom momento para comprar ou vender Venice Token (VVV), é importante primeiro se alinhar à sua própria estratégia de trading e perfil de risco. Investidores de longo prazo e traders de curto prazo geralmente interpretam as condições de mercado de forma diferente, então sua decisão deve refletir a sua abordagem pessoal. De acordo com a análise técnica de 4 horas mais recente de VVV, o sinal de trading atual é Hold. De acordo com a mais recente análise técnica de 1 dia de VVV, o sinal atual é Comprar.
50
Hold
Análise técnica de 4 horas de VVV
Última Atualização 2026-06-20 19:59:59
60
Comprar
Análise técnica de 1 dia de VVV
Última Atualização 2026-06-19 23:59:59
beacon

Previsão do Beacon

Previsão Probabilística de Preço (Próximas 24 horas)
i
Aviso de Isenção de Responsabilidade de Previsões do Beacon
Os resultados dos dados exibidos nesta página são analisados com base em dados de negociação reais (OHLCV) do par de trading selecionado, juntamente com indicadores técnicos correspondentes.
Esta previsão é um produto técnico experimental, fornecida apenas para fins de referência. Ela não constitui uma orientação de investimento. Eventos inesperados no mundo real podem afetar significativamente o comportamento do mercado. Os traders devem tomar decisões com cautela.
Sobre Venice Token
Venice Token (VVV) is a cryptocurrency launched in 2025and operates on the Base platform. Venice Token has a current supply of 80,320,069.93248787 with 46,985,575.1913625 in circulation. The last known price of Venice Token is 16.3609276 USD and is down -1.92 over the last 24 hours. It is currently trading on 212 active market(s) with $47,535,520.30 traded over the last 24 hours. More information can be found at https://venice.ai/home.
Leia mais