Купить криптовалюту
карта
P2P Трейдинг
Купить USDT через маркетплейс
Кредитная/дебетовая карта
Покупайте криптовалюту с помощью карт Visa или Mastercard
Оплата третьей стороной
Buy Crypto via MoonPay, Simplex and More
Карта BitMart
Расширение ваших криптовозможностей
Предоплаченная криптовалютная карта
Мгновенно получите карту Mastercard, доступную для использования
USDⓈ-M
Использовать USDⓈ в качестве обеспечения
COIN-M
Использовать монету в качестве обеспечения
TradFi
Единый центр торговли металлами, акциями и иностранной валютой
Демо-торговля
Узнайте, как торговать с нулевым риском
Фьючерсная торговля
Универсальная платформа для фьючерсной торговли
Futures King
478,000 USDT Prize Pool
Grow
Обзор программы Earn
Без труда зарабатывайте на незадействованных активах
Сбережения
Зарабатывайте проценты на холдинге
Стейкинг
Простой стейкинг и хорошие вознаграждения
Управление капиталом
Grow Wealth with a Top-Tier Asset Team
RWA
Удерживайте BMRUSD и получайте доход
VIP-эксклюзив
Стабильный заработок для VIP-пользователей
Rewards
Центр вознаграждений
Discover Exclusive Rewards Worth Up to 14,000 USDT
LaunchPrime
Платформа для запуска NFT и токенов
Партнерская программа
Присоединяйтесь к программе, чтобы зарабатывать высокие комиссионные
Powerdrop
Запущено решение для Аирдропов нового поколения!
Центр событий
The One-Stop Hub For All Business Operations
Futures Daily Draw
100% Chance To Win With Daily Trades
Spot Daily Draw
Win 8,888 USDT In Grand Prizes
Участвуйте в стейкинге для голосования
Заработайте эйрдропы, проголосовав
Учреждение
Профессиональные и эксклюзивные сервисы
VIP
Разблокируйте Эксклюзивные Награды
Академия
Быстро изучите трейдинг и блокчейн
BitMart Internship
Start your Crypto Career Here
Bitmart Путешествия
One-Stop Global Travel Services
Mobile Top-Up
Top up mobiles easily, online, secure
Send
Send money globally, fast and secure
BitMart Mall
Live on crypto

Bitcoin Base Данные о ценах в реальном времени
Today's price of Bitcoin Base Is $ 59,125.51 (BTC/USD). With A Market Cap Of $ 1.24T USD. 24-Hour Trading Volume Of $ 333.31M USD, A 24-Hour Price Change Of -3.46%, And A Circulating Supply Of 20.91M BTC.
Bitcoin Base BTC Price History USD
Track the price of Bitcoin Base for today, 7 days, 30 days and 90 days
Период
Изменить
Изменение (%)
Сегодня
$ 1,968.22
-3.22%
7дней
$ 4,545.01
-7.13%
30дней
$ 18,057.00
-23.38%
90дней
$ 8,598.34
-12.68%
Own BTC Now
Buy and sell BTC easily and securely on BitMart.
Bitcoin Base Информация о рынке
$ 58,056.75 24 часа $ 61,884.33
Рекордный максимум
$ 126,040.55
Рекордный минимум
$ 631.20
Изменение за 24 часа
-3.46%
Объем за 24 часа
$ 333,305,127.06
Количество токенов в обороте
20.04M
BTC
Рыночная капитализация
$ 1.19T
Максимальное предложение
21.00M
BTC
Рыночная капитализация при полной эмиссии
$ 1.24T
Торговать BTC
Заработать
Даже незадействованная криптовалюта может приносить пассивный доход! Пользуйтесь сбережениями, услугами стейкинга и другими преимуществами.
Bitcoin Base Инсайт из X

Bitcoin Takeover (BTCTKVR.com)
Educator
Media
C
 4.2K @BTCTKVR
 Бычий
The program will discuss Bitcoin mortgage loan strategies in a bear market, encouraging holding BTC instead of selling.
Bitcoin Takeover (BTCTKVR.com)
Educator
Media
C
4.2K @BTCTKVR Our next episode will be live later today.
The guest will be @MatejkaMar, CEO of @firefish_i.
If you have any questions that you want us to ask, please leave a comment or comment while the show is happening.
19:00 GMT/14:00 EST
A wise man once said, $BTC backed loans are for the bear market... so you best tune in.

 2
2
 0
0
 107
107
2026-06-25 14:28
Тренд BTC после выпуска
Бычий
The program will discuss Bitcoin mortgage loan strategies in a bear market, encouraging holding BTC instead of selling.

Healthy Pockets
Media
Influencer
C
310.3K @healthy_pockets Нейтрально
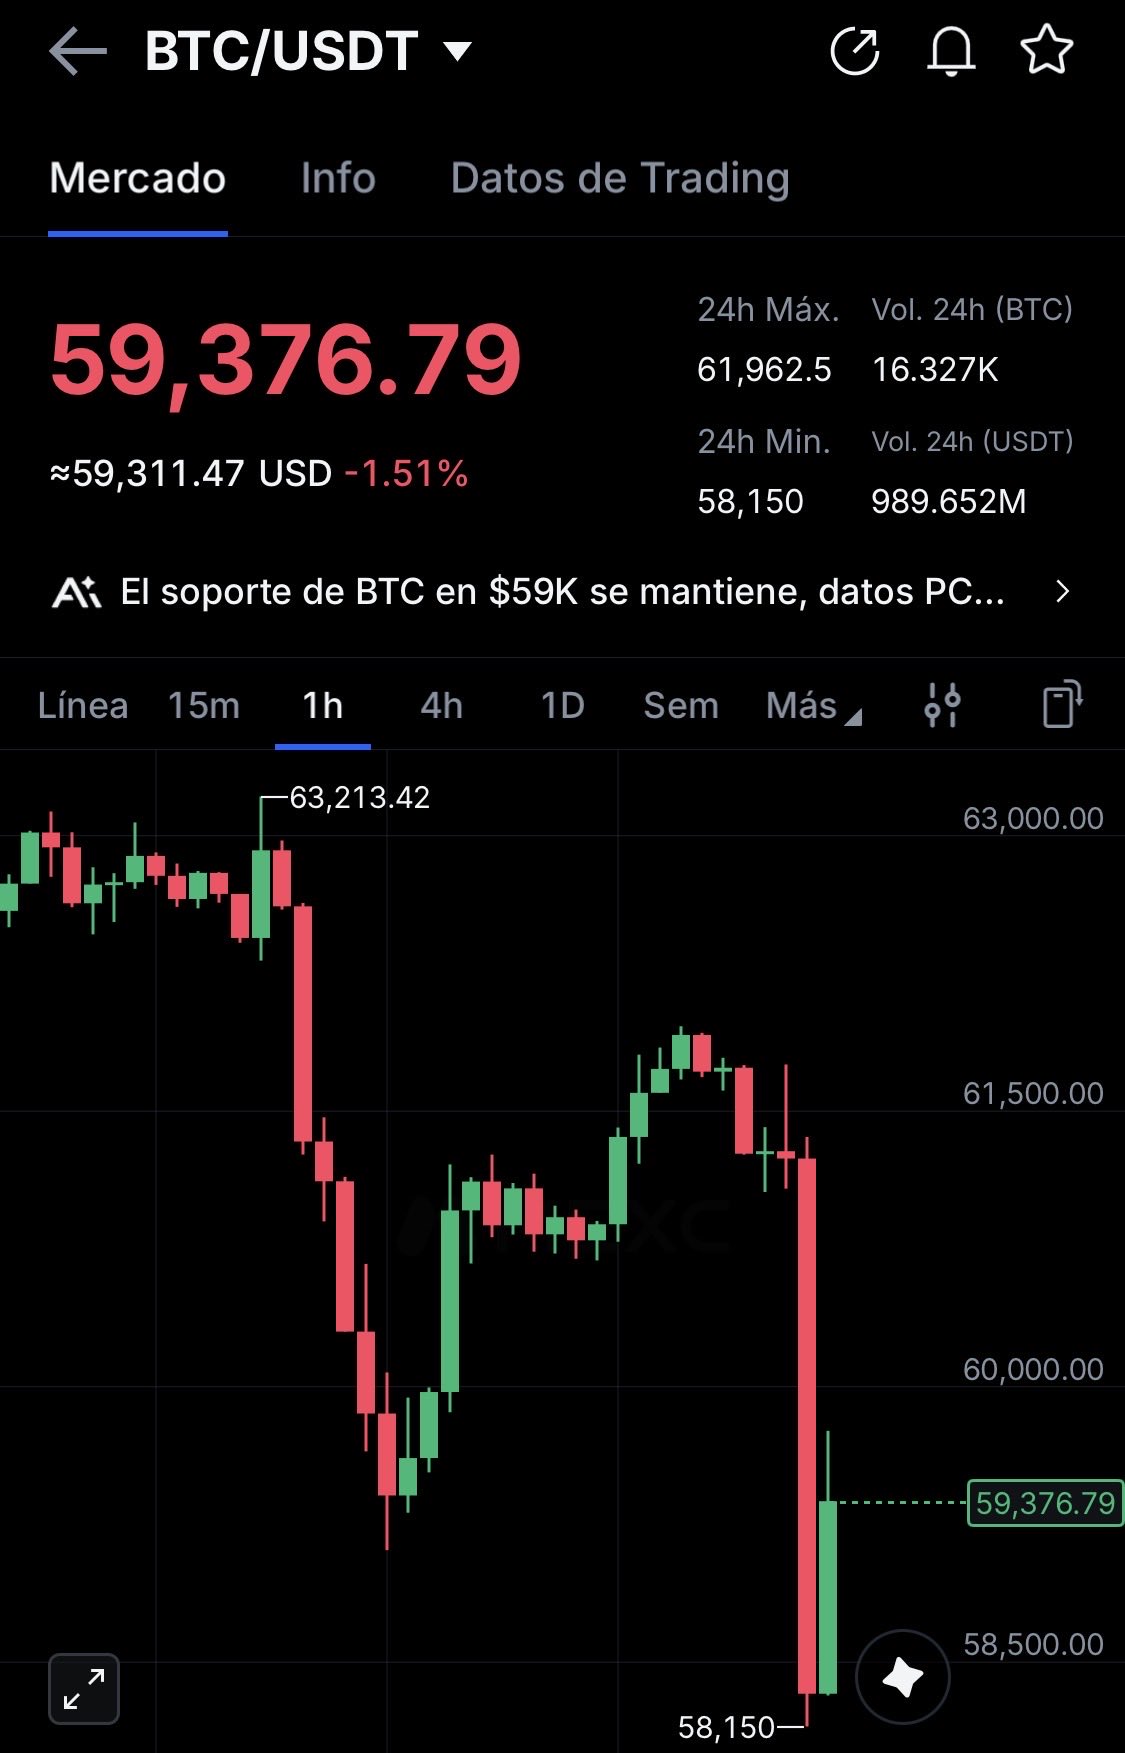
Bitcoin briefly fell below 59k and quickly rebounded, the 59k support level remains effective.
🚨PRICE ALERT🚨
Bitcoin just took a tumble below 59k 👀‼️ https://t.co/pHMXTY2TVB
 3
0
1.3K
3
0
1.3K
2026-06-25 14:27
Тренд BTC после выпуска
Нейтрально
Bitcoin briefly fell below 59k and quickly rebounded, the 59k support level remains effective.

Satoshi Stacker
TA_Analyst
OnChain_Analyst
C
233.0K @StackerSatoshi Медвежий
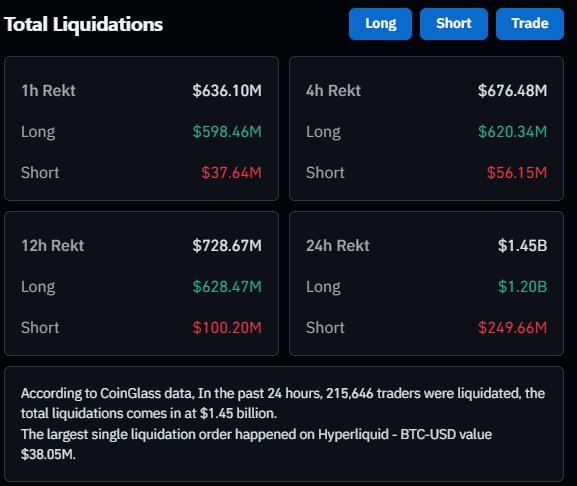
市场过去24小时清算12亿美元多头,BTC-USD单笔最大清算3805万美元。
That was a HUGE liquidation cascade to start the US session with $600M of longs liquidated in a single hour and $1.2B of longs rekt over the past 24 hours. https://t.co/tpZuAZDgLa
 4
0
3.3K
4
0
3.3K
2026-06-25 14:27
Тренд BTC после выпуска
Чрезвычайно медвежий
市场过去24小时清算12亿美元多头,BTC-USD单笔最大清算3805万美元。
Прогнозирование цен
When is a good time to buy BTC? Should I buy or sell BTC now?
When deciding whether it’s a good time to buy or sell Bitcoin Base (BTC), it’s important to first align with your own trading strategy and risk profile.Long-term investors and short-term traders often interpret market conditions differently, so your decision should reflect your personal approach. According to the latest BTC 4-hour technical analysis, the current trading signal is Hold. According to the latest BTC 1-day technical analysis, the current signal is Hold.

Прогноз Beacon
Probabilistic Price Forecast (Next 24 Hours)Отказ от ответственности за прогноз Beacon
The data results displayed on this page are analyzed based on actual trading data (OHLCV) of the selected trading pair along with corresponding technical indicators.
This prediction is an experimental technical product and is provided for reference purposes only. It does not constitute investment advice. Unexpected real-world events may significantly impact market behavior. Traders should make decisions with caution.
This prediction is an experimental technical product and is provided for reference purposes only. It does not constitute investment advice. Unexpected real-world events may significantly impact market behavior. Traders should make decisions with caution.
Вопросы и ответы
How Many Bitcoins Are There?
How Much Is Bitcoin Today?
What Is Bitcoin Mining?
О нас Bitcoin Base
Биткойн (BTC) - это цифровой актив и платежная система, изобретенная Сатоши Накамото, который опубликовал соответствующий документ в 2008 году и выпустил его в виде программного обеспечения с открытым исходным кодом в 2009 году. Система работает по принципу peer-to-peer; пользователи могут совершать сделки напрямую, без посредников. Транзакции проверяются узлами сети и записываются в публичную распределенную бухгалтерскую книгу, называемую блокчейном. В качестве расчетной единицы в этой книге используется биткоин. Система работает без центрального хранилища или единого администратора, что заставило Казначейство США классифицировать биткоин как децентрализованную виртуальную валюту. Биткойн часто называют первой криптовалютой, хотя существовали и предыдущие системы. Биткойн правильнее называть первой децентрализованной цифровой валютой. На сегодняшний день она является крупнейшей в своем роде по общей рыночной стоимости.
Читать далее
Официальные ссылки
Социальные сети
Explore More
BM Discovery


Новые листинги

SQQQON ProShares UltraPro Short QQQ
-- 0.00%

IBITON iShares Bitcoin Trust ETF
-- 0.00%

AMCON AMC Entertainment Holdings
-- 0.00%

GRABON Grab Holdings
-- 0.00%

SNAPON Snap(Ondo)
-- 0.00%

NES Nesa
-- 0.00%

HIVEON HIVE Digital Technologies
-- 0.00%

SOXSON Direxion Daily Semi Bear 3X ETF
-- 0.00%

TON AT&T Tokenized Stock (Ondo)
-- 0.00%

KEELON Keel Infrastructure
-- 0.00%
Купить BTC
Торговать BTC