活動
合約每日抽獎
每日交易100%中獎
現貨每日抽獎
抽 8,888 USDT 豪禮
投票上幣
投票支持區塊鏈資產,賺取空投
機構
專為機構打造的解決方案
VIP
解鎖專屬福利
BitMart 學院
快速學習入門交易,瞭解區塊鏈知識
BitMart 大使
學習、建設 Web3,從 BitMart 起航
BitMart Travel
全球旅行服務,一站式預訂
BitMart話費充值
話費、流量、套餐便攜充值
轉帳
安全便捷,隨時隨地全球匯款
幣市商城
用加密貨幣滿足您的一切消費需求

Peezy 0x69 (PEEZY)
$ 0.00000041 (PEEZY/USD)
-3.91%
24H
Peezy 0x69 實時價格數據
今日Peezy 0x69的實時價格為$ 0.00000041 (PEEZY/USD), 當前市值為 $ 127.41K USD。 24小時的成交量為 $ 3,049.41 USD。 過去24小時內漲跌幅為 -3.91%, 流通量為 305.65B PEEZY。
Peezy 0x69 PEEZY 價格歷史 USD
跟蹤 Peezy 0x69 的今日價格、7天、30天和90天價格
週期
漲跌
漲跌幅 (%)
今日
$ 0.000000016
-3.91%
7日
$ 0.000000052
-10.74%
30日
$ 0.00000023
-34.95%
90日
$ 0.000000035
-7.50%

Peezy 0x69 市場信息
$ 0.00000039 24小時價格浮動區間 $ 0.00000043
歷史最高
$ 0.00000094
歷史最低
$ 0.00000018
24小時漲跌幅
-3.91%
24小時交易量
$ 3,049.41
流通供給
305.65B
PEEZY
市值
$ 127.41K
最大供給
420.69B
PEEZY
完全稀釋的市值
$ 175.36K
交易 PEEZY

Peezy 0x69 社交媒體動態

davie satoshi
TA_Analyst
NFT_Expert
B
 27.3K @NFTdavie
 看漲
PEEZY technical analysis shows two paths: bullish if support holds, bearish if it breaks.
davie satoshi
TA_Analyst
NFT_Expert
B
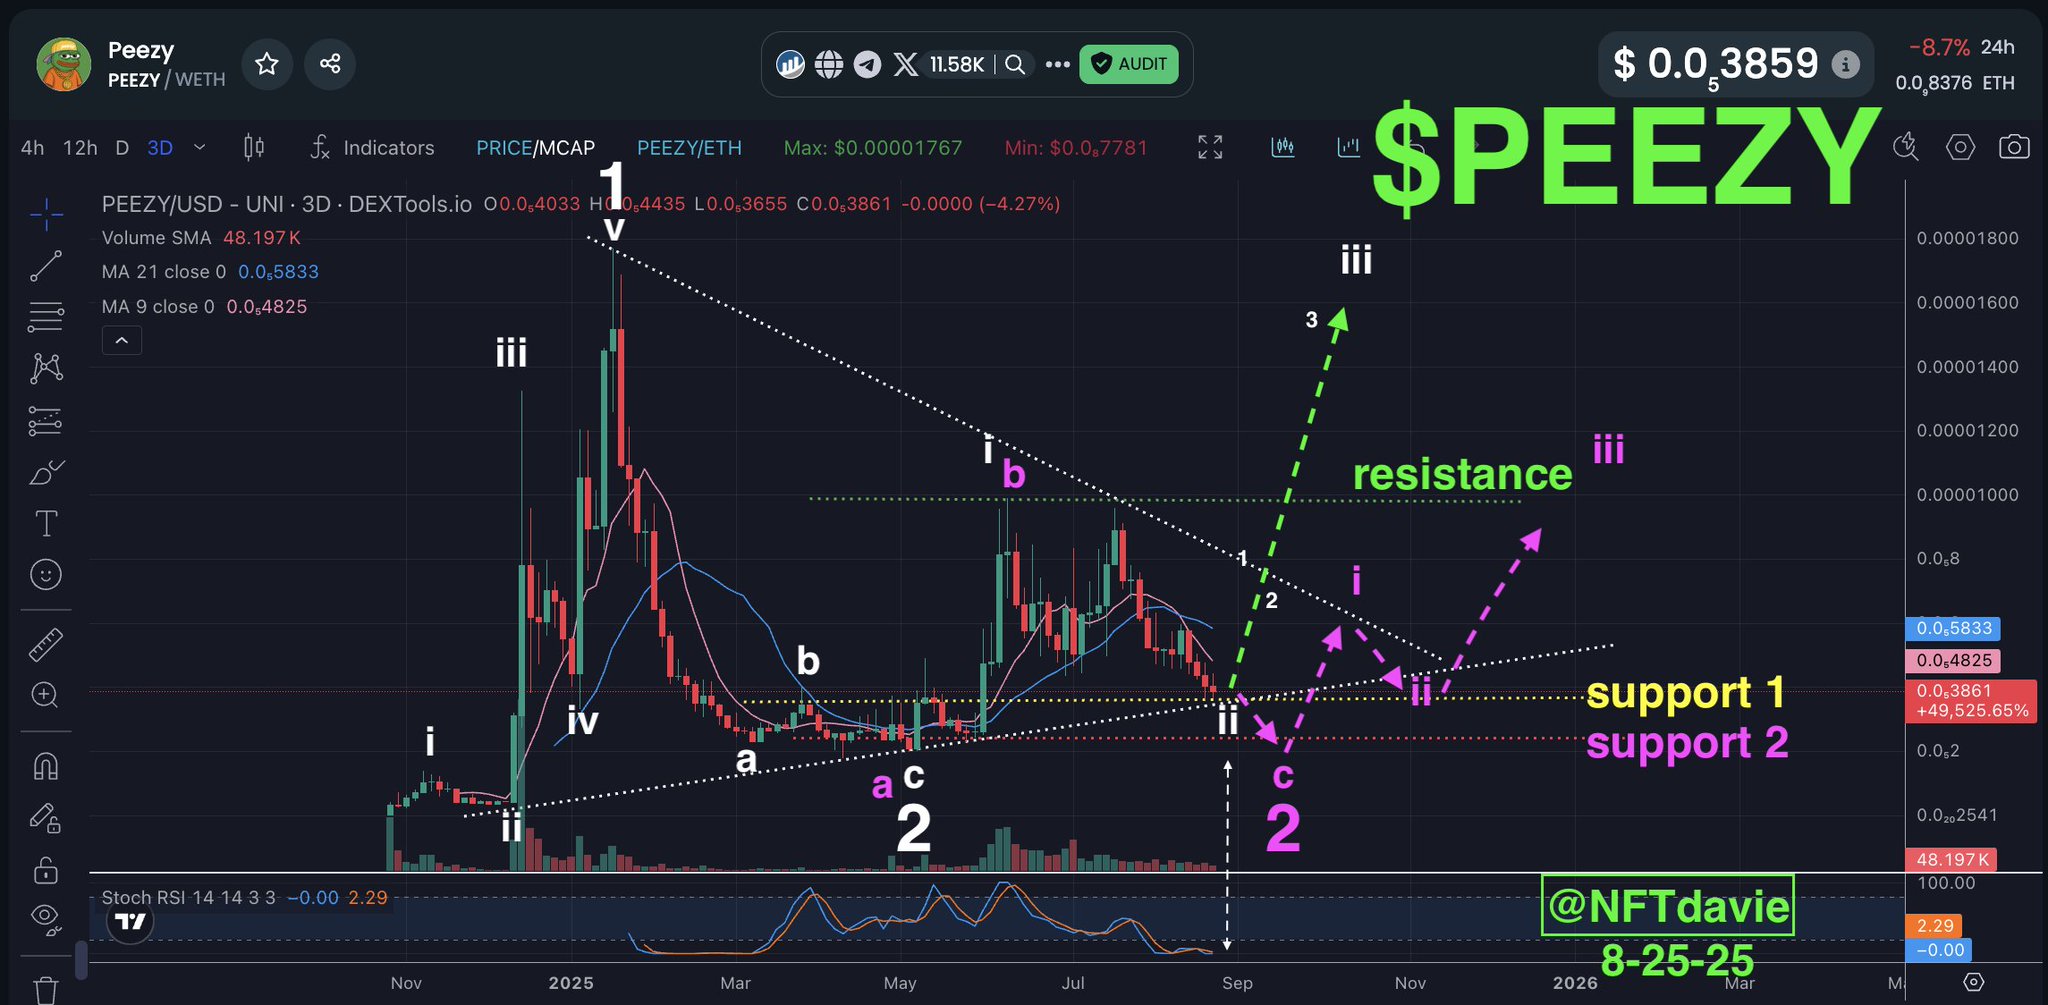
27.3K @NFTdavie Rapid Fire Charts: $PEEZY
PEEZY has many possible routes but here are the two likely routes IMO.
Bullish - GREEN/WHITE - In this scenario, major wave 2 has completed in spring of 2025 and the subsequent waves afterwards are part of major wave 3. We can make out a subwave i of 3 (labeled white i) and wave ii of 3 looks about complete (white ii where we are currently). There are two major support lines here (yellow/white) intersecting which should be strong. That should lead to a bounce here and the beginning of wave iii of 3.
Bearish - PINK - In this scenario, major wave 2 has not completed and $PEEZY is a laggard in the altcoin/memecoin trend. If it falls below the two intersecting support line (yellow and white), then it will fall onto the next one (pink). This does correspond better with the historic low stoch RSI reading on the 3 day chart as the low readings tend to correlate to major wave 2's. In this scenario, the climb back up begins with sub wave i and so forth. This scenario paints a picture of th
 42
42
 13
13
 2.8K
2.8K
2025-08-28 19:24
發佈後PEEZY走勢
看漲
PEEZY technical analysis shows two paths: bullish if support holds, bearish if it breaks.

Jools
Dev
Influencer
B
20.1K @jewelsindefi 看漲
Predicting that ETH's rise will lead to buying interest for PEEZY.
When $ETH goes crazy, long standing communities like $PEEZY will eventually catch a bid.
Peezy money.
39
7
1.4K
2025-08-28 13:13
發佈後PEEZY走勢
看漲
Predicting that ETH's rise will lead to buying interest for PEEZY.
davie satoshi
TA_Analyst
NFT_Expert
B
27.3K @NFTdavie 中性
PEEZY technical analysis shows two paths: bullish if support holds, bearish if it breaks.
Rapid Fire Charts: $PEEZY
PEEZY has many possible routes but here are the two likely routes IMO.
Bullish - GREEN/WHITE - In this scenario, major wave 2 has completed in spring of 2025 and the subsequent waves afterwards are part of major wave 3. We can make out a subwave i of 3 (labeled white i) and wave ii of 3 looks about complete (white ii where we are currently). There are two major support lines here (yellow/white) intersecting which should be strong. That should lead to a bounce here and the beginning of wave iii of 3.
Bearish - PINK - In this scenario, major wave 2 has not completed and $PEEZY is a laggard in the altcoin/memecoin trend. If it falls below the two intersecting support line (yellow and white), then it will fall onto the next one (pink). This does correspond better with the historic low stoch RSI reading on the 3 day chart as the low readings tend to correlate to major wave 2's. In this scenario, the climb back up begins with sub wave i and so forth. This scenario paints a picture of th
42
13
2.8K
2025-08-25 16:15
發佈後PEEZY走勢
中性
PEEZY technical analysis shows two paths: bullish if support holds, bearish if it breaks.
價格預測
什麼時候是購買PEEZY的好時機?我應該現在買入還是賣出PEEZY?
在判斷現在是否是買入或賣出 Peezy 0x69 (PEEZY) 的合適時機時,首先需要結合自身的交易策略和風險承受能力。長期投資者與短期交易者對市場信號的解讀往往不同,因此建議根據個人交易計劃做出決策。 根據最新的 PEEZY 4 小時技術分析,當前交易信號為買入。 根據最新的 PEEZY 1 天技術分析,當前交易信號為持有。

Beacon預測
概率價格預測(未來24小時)Beacon預測免責聲明
當面頁面的數據結果基於當前交易對的實際交易數據(OCHLV)和相應的指標計算,然後進行分析得出結果。
此預測為實驗性技術產品,僅供參考,不構成投資建議。現實生活中的任何突發事件都可能對交易行為產生重大影響,因此交易者應謹慎決策。
此預測為實驗性技術產品,僅供參考,不構成投資建議。現實生活中的任何突發事件都可能對交易行為產生重大影響,因此交易者應謹慎決策。
關於 Peezy 0x69
Peezy 0x69 (PEEZY) is a cryptocurrency launched in 2024and operates on the Ethereum platform. Peezy 0x69 has a current supply of 359,709,061,786 with 305,650,329,936 in circulation. The last known price of Peezy 0x69 is 0.00000046 USD and is down -0.35 over the last 24 hours. It is currently trading on 10 active market(s) with $3,606.92 traded over the last 24 hours. More information can be found at https://peezy.vip/.
查看更多
探索更多
BM發現


新上市

NES Nesa
-- 0.00%

HIVEON HIVE Digital Technologies
-- 0.00%

SOXSON Direxion Daily Semi Bear 3X ETF
-- 0.00%

TON AT&T Tokenized Stock (Ondo)
-- 0.00%

KEELON Keel Infrastructure
-- 0.00%

DRAMON Roundhill Memory ETF
-- 0.00%

JAM JAM Coin
-- 0.00%

UMXM Manadia
-- 0.00%

UMCON United Microelectronics Tokenized Stock (Ondo)
-- 0.00%

AMKRON Amkor Technology Tokenized Stock (Ondo)
-- 0.00%