Rewards
Futures Daily Draw
100% Chance To Win With Daily Trades
Spot Daily Draw
Win 8,888 USDT In Grand Prizes
Mobile Top-Up
Top up mobiles easily, online, secure
Send
Send money globally, fast and secure
BitMart Mall
Live on crypto

Bitcoin Base Live Price data
Today's price of Bitcoin Base Is $ 59,942.34 (BTC/USD). With A Market Cap Of $ 1.25T USD. 24-Hour Trading Volume Of $ 336.74M USD, A 24-Hour Price Change Of -2.04%, And A Circulating Supply Of 20.91M BTC.
Bitcoin Base BTC Price History USD
Track the price of Bitcoin Base for today, 7 days, 30 days and 90 days
Period
Change
Change (%)
Today
$ 1,024.82
-1.68%
7days
$ 3,601.61
-5.65%
30days
$ 17,113.60
-22.16%
90days
$ 7,654.94
-11.29%
Own BTC Now
Buy and sell BTC easily and securely on BitMart.
Bitcoin Base Market Information
$ 58,056.75 24h Range $ 61,884.33
All time high
$ 126,040.55
All time low
$ 631.20
24h Change
-2.03%
24h Vol
$ 336,735,240.25
Circulating supply
20.04M
BTC
Market cap
$ 1.20T
Max supply
21.00M
BTC
Fully diluted market cap
$ 1.26T
Trade BTC

Bitcoin Base X Insight

Bitcoin Takeover (BTCTKVR.com)
Educator
Media
C
 4.2K @BTCTKVR
 Bullish
The program will discuss Bitcoin mortgage loan strategies in a bear market, encouraging holding BTC instead of selling.
Bitcoin Takeover (BTCTKVR.com)
Educator
Media
C
4.2K @BTCTKVR Our next episode will be live later today.
The guest will be @MatejkaMar, CEO of @firefish_i.
If you have any questions that you want us to ask, please leave a comment or comment while the show is happening.
19:00 GMT/14:00 EST
A wise man once said, $BTC backed loans are for the bear market... so you best tune in.
 2
2
 0
0
 107
107
2026-06-25 14:28
Trend of BTC after release
Bullish
The program will discuss Bitcoin mortgage loan strategies in a bear market, encouraging holding BTC instead of selling.

Healthy Pockets
Media
Influencer
C
310.3K @healthy_pockets Neutral
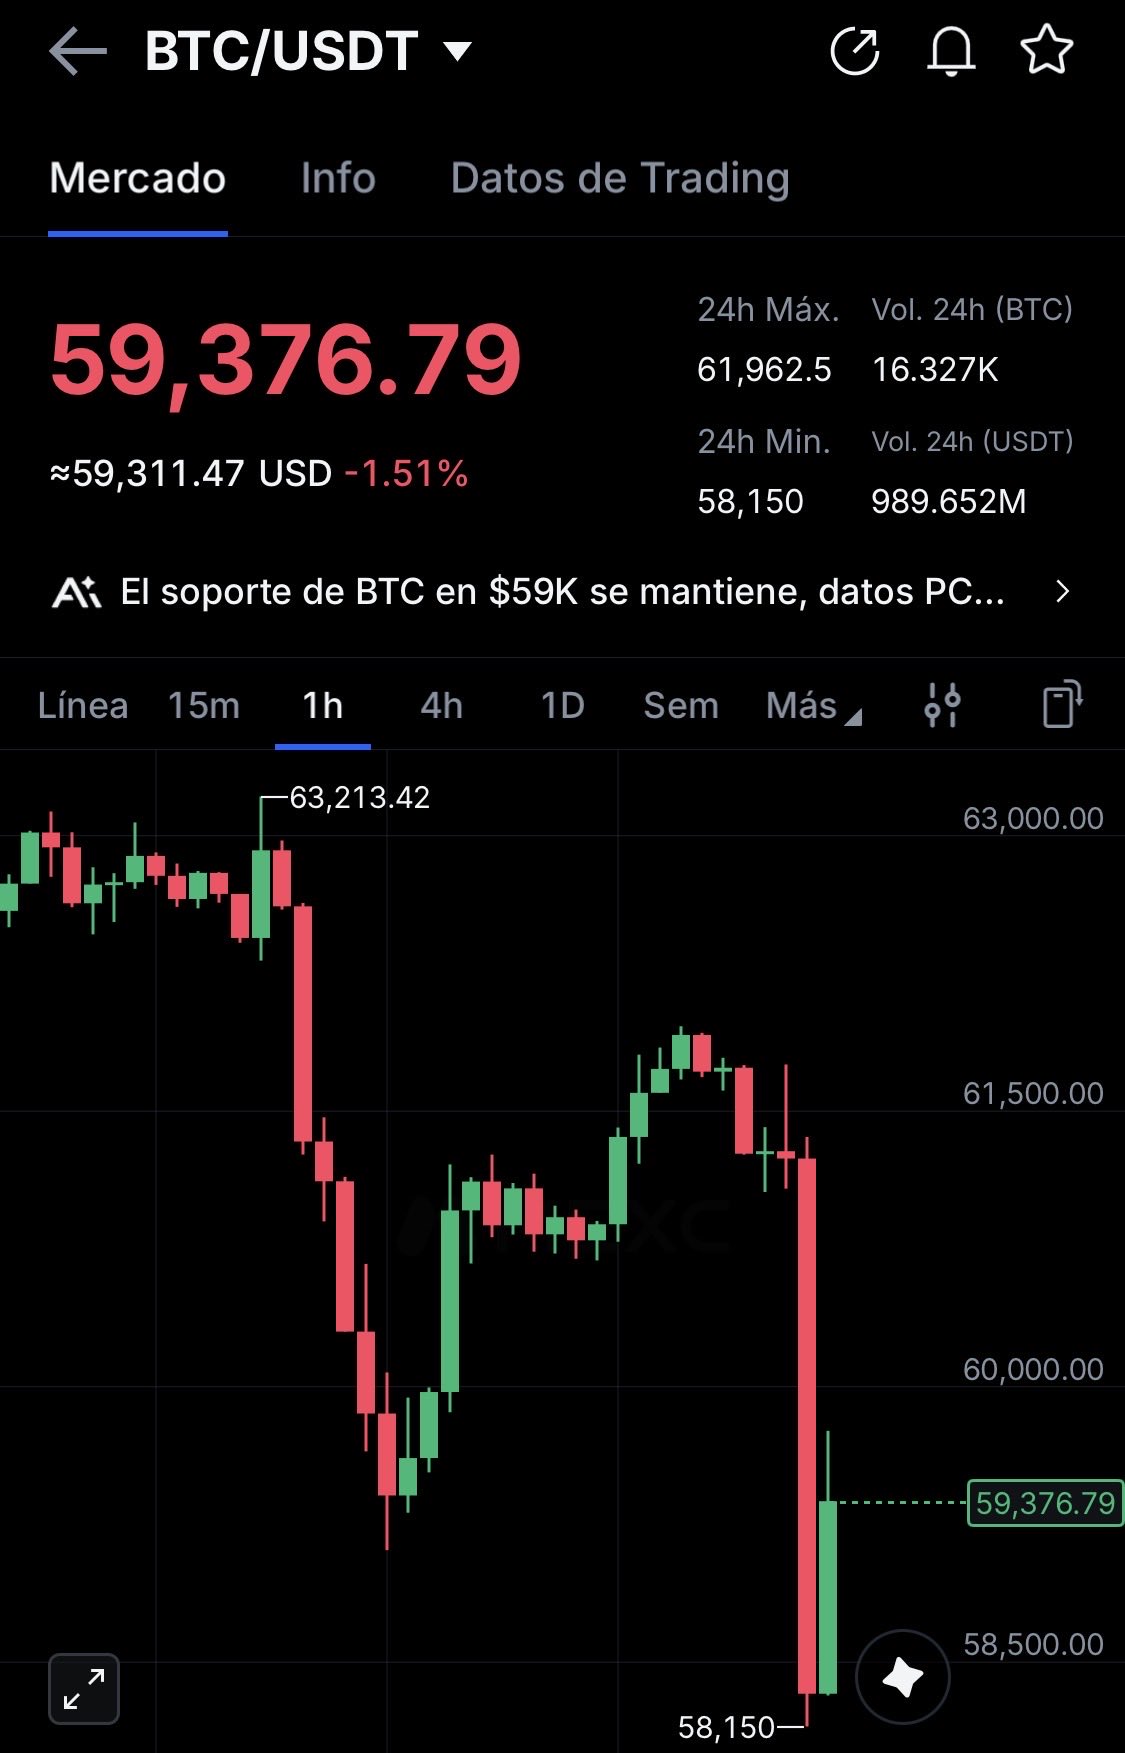
Bitcoin briefly fell below 59k and quickly rebounded, the 59k support level remains effective.
🚨PRICE ALERT🚨
Bitcoin just took a tumble below 59k 👀‼️ https://t.co/pHMXTY2TVB
 3
0
1.3K
3
0
1.3K
2026-06-25 14:27
Trend of BTC after release
Neutral
Bitcoin briefly fell below 59k and quickly rebounded, the 59k support level remains effective.

Satoshi Stacker
TA_Analyst
OnChain_Analyst
C
233.0K @StackerSatoshi Bearish
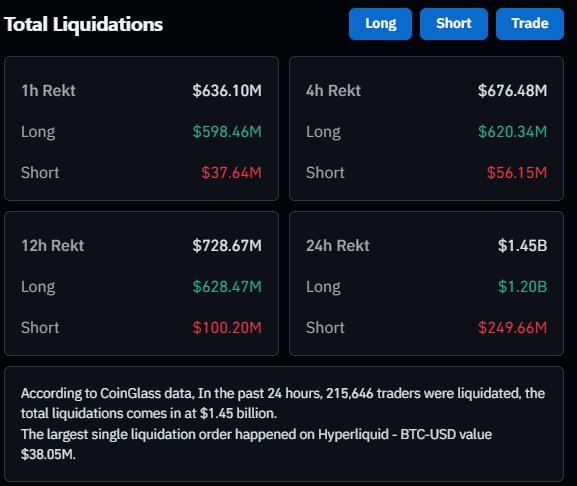
市场过去24小时清算12亿美元多头,BTC-USD单笔最大清算3805万美元。
That was a HUGE liquidation cascade to start the US session with $600M of longs liquidated in a single hour and $1.2B of longs rekt over the past 24 hours. https://t.co/tpZuAZDgLa
 4
0
3.3K
4
0
3.3K
2026-06-25 14:27
Trend of BTC after release
Extremely Bearish
市场过去24小时清算12亿美元多头,BTC-USD单笔最大清算3805万美元。
Price Prediction
When is a good time to buy BTC? Should I buy or sell BTC now?
When deciding whether it’s a good time to buy or sell Bitcoin Base (BTC), it’s important to first align with your own trading strategy and risk profile.Long-term investors and short-term traders often interpret market conditions differently, so your decision should reflect your personal approach. According to the latest BTC 4-hour technical analysis, the current trading signal is Hold. According to the latest BTC 1-day technical analysis, the current signal is Hold.

Beacon Prediction
Probabilistic Price Forecast (Next 24 Hours)Beacon Prediction Disclaimer
The data results displayed on this page are analyzed based on actual trading data (OHLCV) of the selected trading pair along with corresponding technical indicators.
This prediction is an experimental technical product and is provided for reference purposes only. It does not constitute investment advice. Unexpected real-world events may significantly impact market behavior. Traders should make decisions with caution.
This prediction is an experimental technical product and is provided for reference purposes only. It does not constitute investment advice. Unexpected real-world events may significantly impact market behavior. Traders should make decisions with caution.
Q&A
How Many Bitcoins Are There?
How Much Is Bitcoin Today?
What Is Bitcoin Mining?
About Bitcoin Base
Bitcoin (BTC) is a digital asset and a payment system invented by Satoshi Nakamoto who published a related paper in 2008 and released it as open-source software in 2009. The system featured as peer-to-peer; users can transact directly without an intermediary. Transactions are verified by network nodes and recorded in a public distributed ledger called the blockchain. The ledger uses bitcoin as its unit of account. The system works without a central repository or single administrator, which has led the U.S. Treasury to categorize bitcoin as a decentralized virtual currency. Bitcoin is often called the first cryptocurrency, although prior systems existed. Bitcoin is more correctly described as the first decentralized digital currency. It is the largest of its kind in terms of total market value by now.
Read More
Official Links
Socials
Explore More
BM Discovery


New Listing

SQQQON ProShares UltraPro Short QQQ
-- 0.00%

IBITON iShares Bitcoin Trust ETF
-- 0.00%

AMCON AMC Entertainment Holdings
-- 0.00%

GRABON Grab Holdings
-- 0.00%

SNAPON Snap(Ondo)
-- 0.00%

NES Nesa
-- 0.00%

HIVEON HIVE Digital Technologies
-- 0.00%

SOXSON Direxion Daily Semi Bear 3X ETF
-- 0.00%

TON AT&T Tokenized Stock (Ondo)
-- 0.00%

KEELON Keel Infrastructure
-- 0.00%
Buy BTC
Trade BTC