
I just published **The No-Code Revolution is Here. And It’s Automated.**
#GraphLinq #NoCode #Blockchain #DeFi #Automation #Web3 #AI #GLQ
https://t.co/Q3T0k0lUzi
Rewards
Futures Daily Draw
100% Chance To Win With Daily Trades
Spot Daily Draw
Win 8,888 USDT In Grand Prizes
Mobile Top-Up
Top up mobiles easily, online, secure
Send
Send money globally, fast and secure
BitMart Mall
Live on crypto

Graphlinq Chain (GLQ)
$ 0.0025 (GLQ/USD)
-6.88%
24H
Graphlinq Chain Live Price data
Today's price of Graphlinq Chain Is $ 0.0025 (GLQ/USD). With A Market Cap Of $ 872.61K USD. 24-Hour Trading Volume Of $ 72,851.17 USD, A 24-Hour Price Change Of -6.88%, And A Circulating Supply Of 340.00M GLQ.
Graphlinq Chain GLQ Price History USD
Track the price of Graphlinq Chain for today, 7 days, 30 days and 90 days
Period
Change
Change (%)
Today
$ 0.00018
-6.88%
7days
$ 0.00012
-4.61%
30days
$ 0.0012
-32.58%
90days
$ 0.0012
-32.07%
Own GLQ Now
Buy and sell GLQ easily and securely on BitMart.
Graphlinq Chain Market Information
$ 0.0025 24h Range $ 0.0027
All time high
$ 0.0084
All time low
$ 0.0025
24h Change
-6.88%
24h Vol
$ 72,851.17
Circulating supply
340.00M
GLQ
Market cap
$ 872.61K
Max supply
--
Fully diluted market cap
$ 1.67M
Trade GLQ
Graphlinq Chain X Insight

Crynet
Media
Researcher
D
 4.2K @crynetio
 Bullish
GLQ launches a no-code DeFi automation platform
 3
3
 1
1
 128
128
2025-11-15 16:14
Trend of GLQ after release
Bullish
GLQ launches a no-code DeFi automation platform

Man of Bitcoin
TA_Analyst
Trader
B
9.3K @Manofbitcoin Bullish
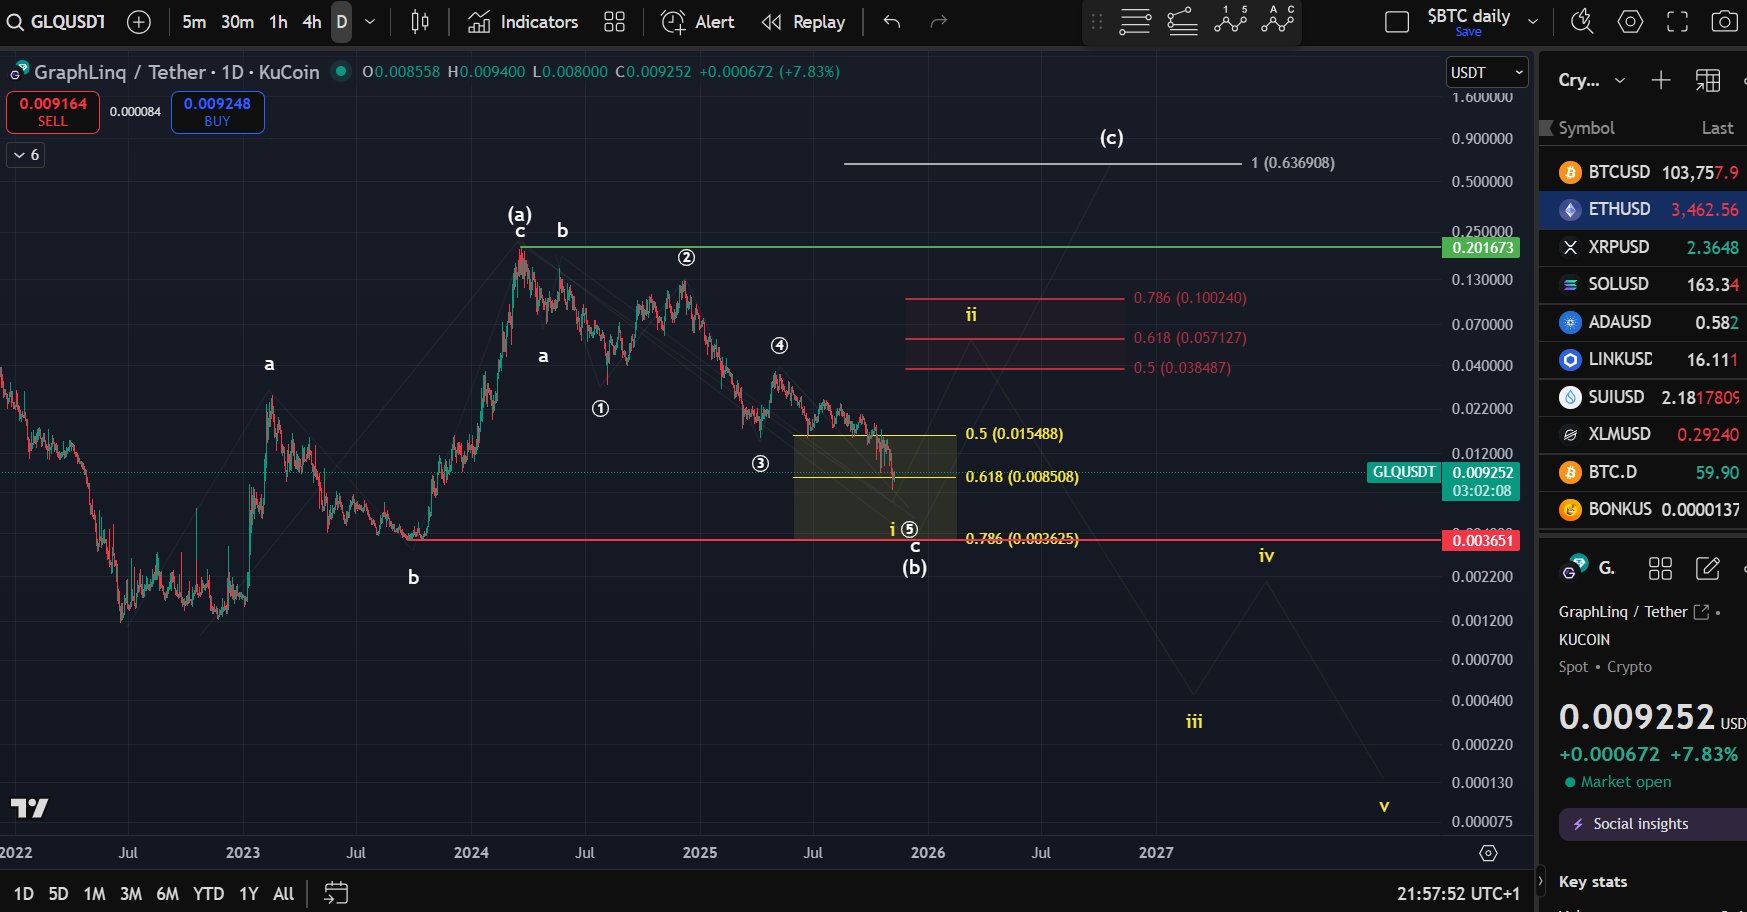
GLQ faces a potential 5-wave bearish decline scenario, but a break above the key resistance zone could lead to an ABC upward correction targeting $0.6369.
$GLQ (by request): A bearish scenario has been added due to the potential 5-wave decline. Resistance for a wave-ii high lies between $0.0384 and $0.1002.A break above this zone would suggest that a larger ABC correction is unfolding to the upside, with an ideal target near $0.6369.
 8
1
1.3K
8
1
1.3K
2025-11-07 21:04
Trend of GLQ after release
Bullish
GLQ faces a potential 5-wave bearish decline scenario, but a break above the key resistance zone could lead to an ABC upward correction targeting $0.6369.
Man of Bitcoin
TA_Analyst
Trader
B
9.3K @Manofbitcoin Extremely Bearish
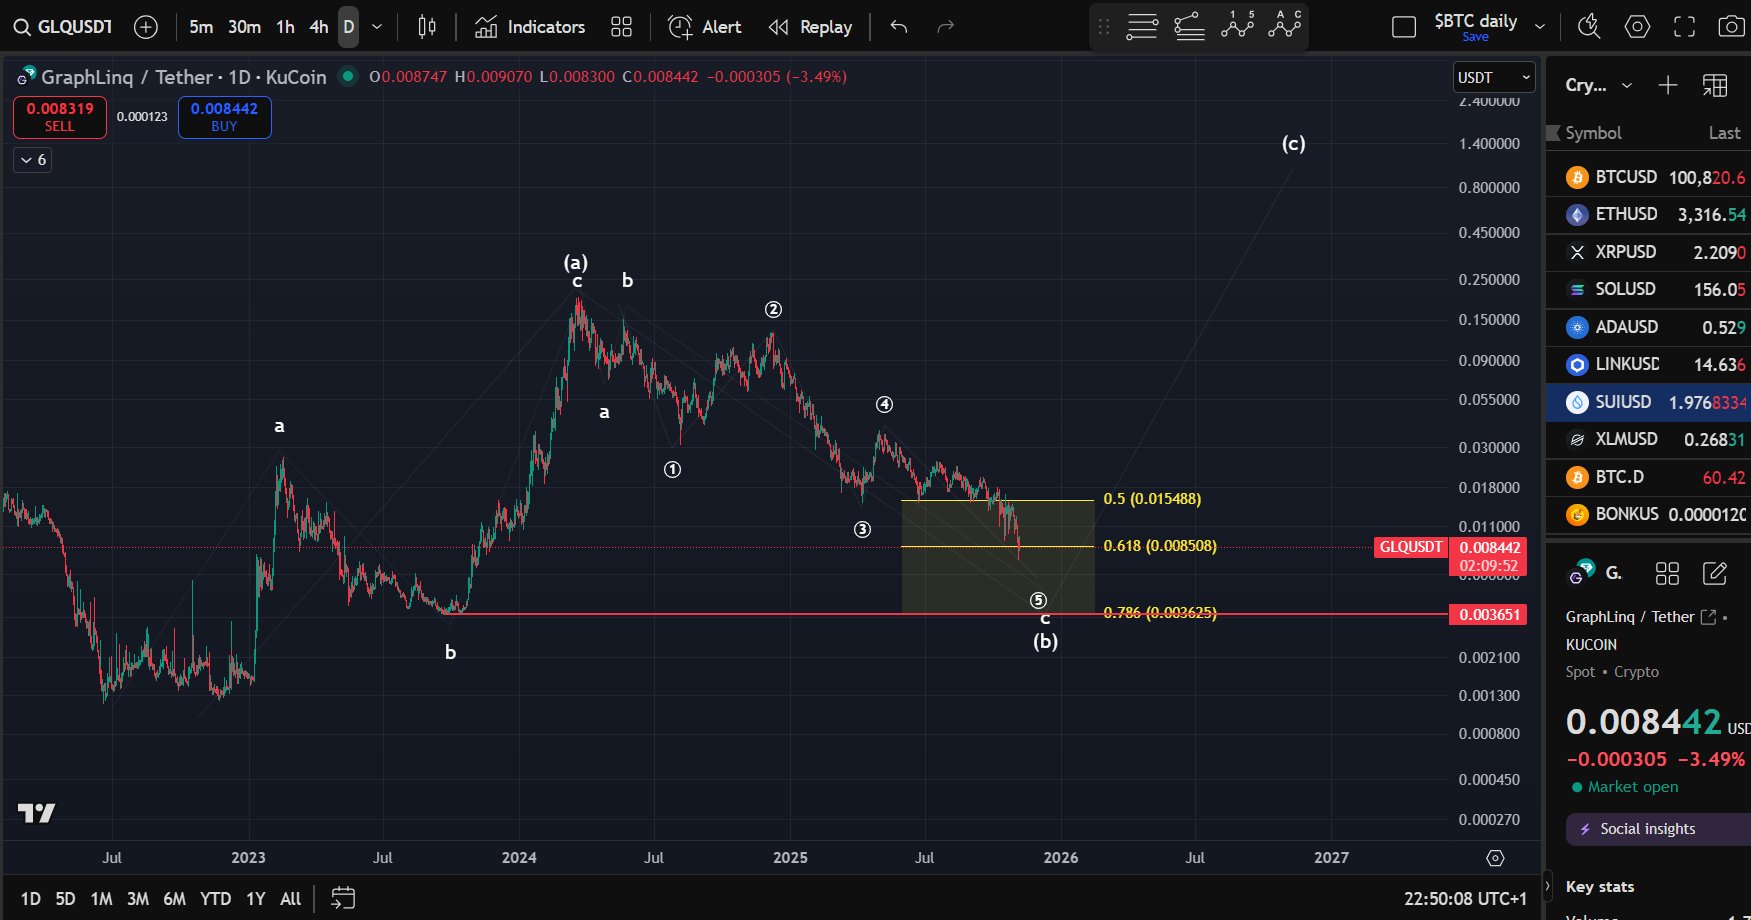
GLQ may be forming an ABC diagonal pattern, has touched the $0.0085 Fibonacci retracement level but the reaction is weak. If support breaks, $0.00365 is a potential reversal zone.
$GLQ: The price may be forming a large ABC diagonal pattern. It has already reached the 61.8% Fib retracement at $0.0085, but the reaction so far remains too weak to be reliable.
If support breaks, the $0.00365 level could serve as the next potential reversal zone. https://t.co/gUwzpKOUwG
 12
1
1.2K
12
1
1.2K
2025-11-06 21:54
Trend of GLQ after release
Bearish
GLQ may be forming an ABC diagonal pattern, has touched the $0.0085 Fibonacci retracement level but the reaction is weak. If support breaks, $0.00365 is a potential reversal zone.
Price Prediction
When is a good time to buy GLQ? Should I buy or sell GLQ now?
When deciding whether it’s a good time to buy or sell Graphlinq Chain (GLQ), it’s important to first align with your own trading strategy and risk profile.Long-term investors and short-term traders often interpret market conditions differently, so your decision should reflect your personal approach. According to the latest GLQ 4-hour technical analysis, the current trading signal is Buy. According to the latest GLQ 1-day technical analysis, the current signal is Hold.

Beacon Prediction
Probabilistic Price Forecast (Next 24 Hours)Beacon Prediction Disclaimer
The data results displayed on this page are analyzed based on actual trading data (OHLCV) of the selected trading pair along with corresponding technical indicators.
This prediction is an experimental technical product and is provided for reference purposes only. It does not constitute investment advice. Unexpected real-world events may significantly impact market behavior. Traders should make decisions with caution.
This prediction is an experimental technical product and is provided for reference purposes only. It does not constitute investment advice. Unexpected real-world events may significantly impact market behavior. Traders should make decisions with caution.
About Graphlinq Chain
Graphlinq Chain (GLQ) is a cryptocurrency launched in 2021. Graphlinq Chain has a current supply of 650,000,000 with 339,999,895 in circulation. The last known price of Graphlinq Chain is 0.00277001 USD and is down -0.25 over the last 24 hours. It is currently trading on 52 active market(s) with $68,080.17 traded over the last 24 hours. More information can be found at https://graphlinq.io/.
Read More
Official Links
Chain Explorer
Explore More
BM Discovery


New Listing

JAM JAM Coin
-- 0.00%

UMXM Manadia
-- 0.00%

UMCON United Microelectronics Tokenized Stock (Ondo)
-- 0.00%

AMKRON Amkor Technology Tokenized Stock (Ondo)
-- 0.00%

AAOION Applied Optoelectronics Tokenized Stock (Ondo)
-- 0.00%

PLON Planet Labs Tokenized Stock (Ondo)
-- 0.00%

HOME Defi App
-- 0.00%

$ARX Arcium
-- 0.00%

DELLON Dell Technologies Tokenized Stock (Ondo)
-- 0.00%

CBRSON Cerebras Systems Tokenized Stock (Ondo)
-- 0.00%