رشد کنید
Rewards
قرعهکشی روزانه
100% Chance To Win With Daily Trades
قرعهکشی روزانه اسپات
Win 8,888 USDT In Grand Prizes
افزایش اعتبار خط همراه
افزایش اعتبار خط همراه بهراحتی، آنلاین و ایمن
Send
Send money globally, fast and secure
BitMart Mall
Live on crypto

Amp دادههای قیمت لحظهای
قیمت امروز Amp برابر با $ 0.00052 (AMP/USD) است. با ارزش بازار برابر با $ 45.24M USD. حجم معاملات 24 ساعته $ 100.44K USD, تغییر قیمت 24 ساعته به میزان -0.57% و عرضه در گردش برابر با 86.78B AMP.
Amp AMP تاریخچه قیمت USD
قیمت Amp را برای امروز، 7 روز، 30 روز و 90 روز پیگیری کنید
دوره
تغییر
تغییر (%)
امروز
$ 0.0000029
-0.57%
7روزها
$ 0.0000039
-0.76%
30روزها
$ 0.00031
-37.49%
90روزها
$ 0.00066
-56.21%
تجارت AMP در سه مرحله
یک حساب کاربری رایگان ایجاد کنید، حساب خود را شارژ کنید، افزودن سپس ارز دیجیتال خود را انتخاب کنید
Amp اطلاعات بازار
$ 0.00051 محدوده ۲۴ ساعته $ 0.00052
بالاترین رکورد زمانی
$ 0.022
همیشه پایین
$ 0.00049
تغییر ۲۴ ساعته
-0.57%
حجم ۲۴ ساعت
$ 100,440.03
عرضه در گردش
86.78B
AMP
مارکت کپ
$ 45.24M
حداکثر عرضه
100.00B
AMP
ارزش بازار کاملاً رقیقشده
$ 52.14M
معامله AMP
کسب درآمد حتی بدون دانش مالی
Put your idle crypto to work and earn passive income through savings, staking, and more.
Amp X Insight

Jeremy Allaire - jerallaire.arc
Founder
Influencer
B
 181.0K @jerallaire
 صعودی
AMP is exploring transaction fairness and PFOF rebate functionality, still pending validation.

Gordon Liao D
9.5K @gordonliao AMP enables transaction fairness, PFOF rebates, and much more. Talk to us if you are interested in exploring serving as a proposer with App-Specific Sequencing and unique order flows.
Note: AMP is exploratory research at this stage until further validation.
 100
100
 10
10
 14.9K
14.9K
2026-06-12 08:27
روند AMP پس از انتشار
صعودی
AMP is exploring transaction fairness and PFOF rebate functionality, still pending validation.

CJ Bennett
TA_Analyst
Educator
B
3.5K @the_real_CJ خنثی
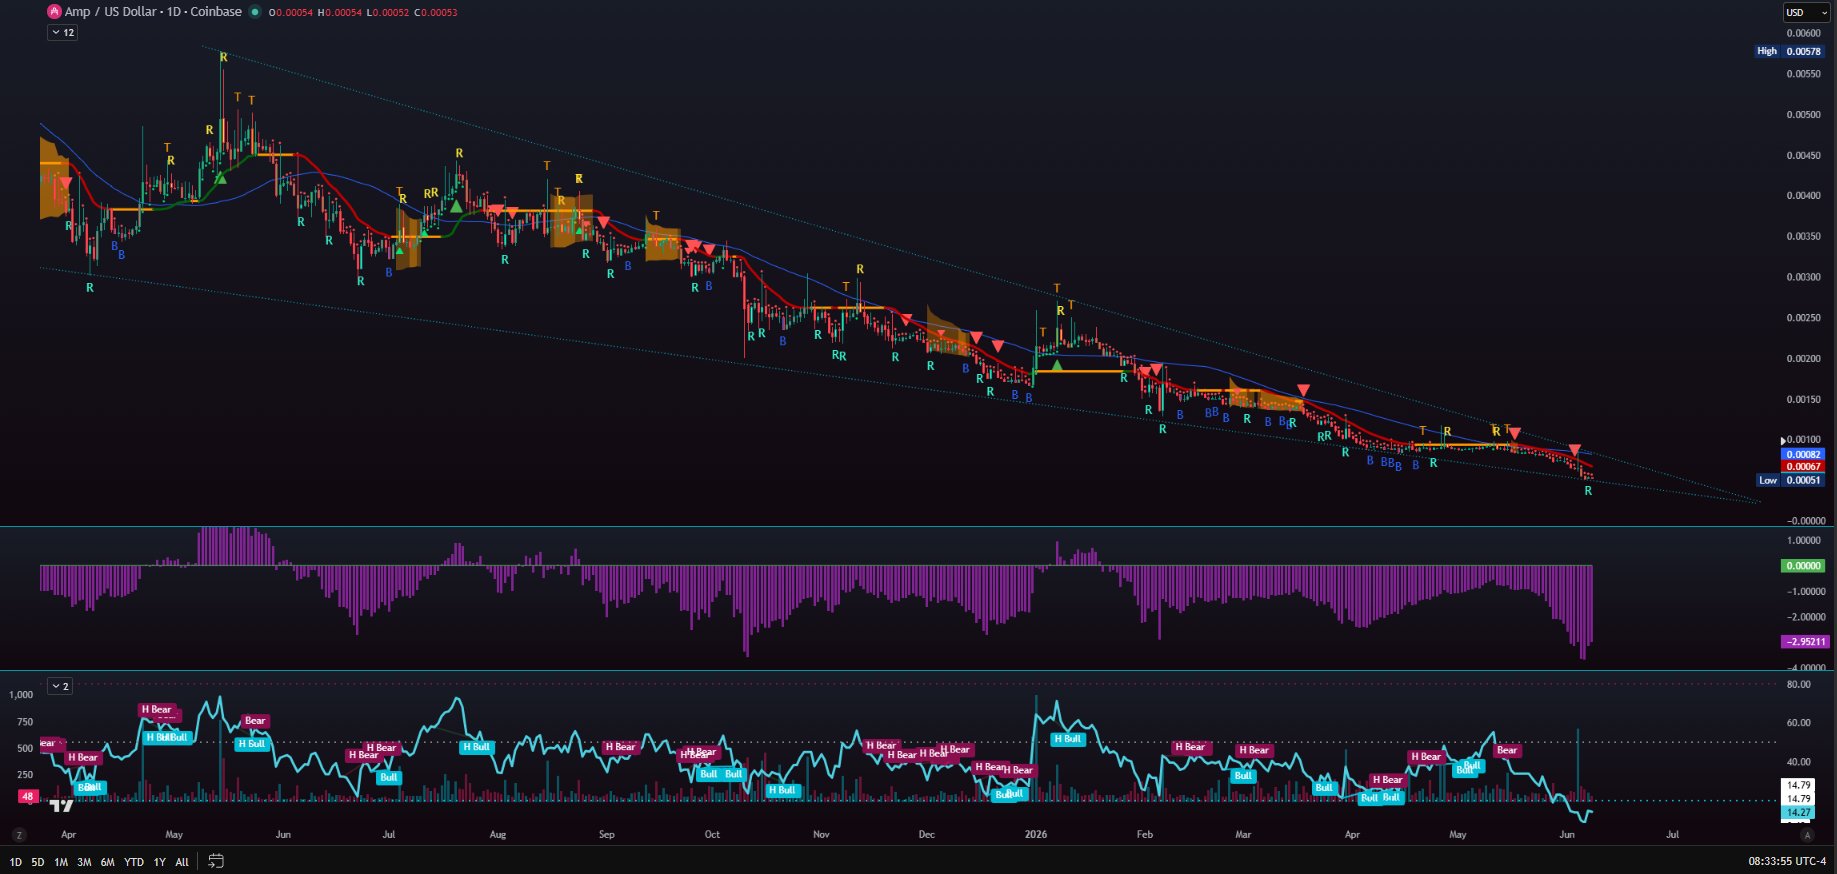
AMP has been in a long-term descending wedge pattern, with RSI severely oversold, and we need to watch whether it can break out and form a new trend before the end of July.
$amp
Still the same setup as the last few years: smaller structure inside a larger structure. The key areas to watch for above and below are still the same.
As time goes on, however, this smaller wedge will need to break inside the larger one. By the end of July, this smaller structure will have to break and create a new trend. The RSI has been horrendous and way oversold, but capitulation is what happens when you hit peak bear market levels. All in all, we just have to continue watching the above and below breaking points. This smaller wedge has been here since last January 2025.
 43
5
1.7K
43
5
1.7K
2026-06-08 12:57
روند AMP پس از انتشار
خنثی
AMP has been in a long-term descending wedge pattern, with RSI severely oversold, and we need to watch whether it can break out and form a new trend before the end of July.

Crypto Tolga
TA_Analyst
Trader
B
79.1K @CryptoTolga_ صعودی
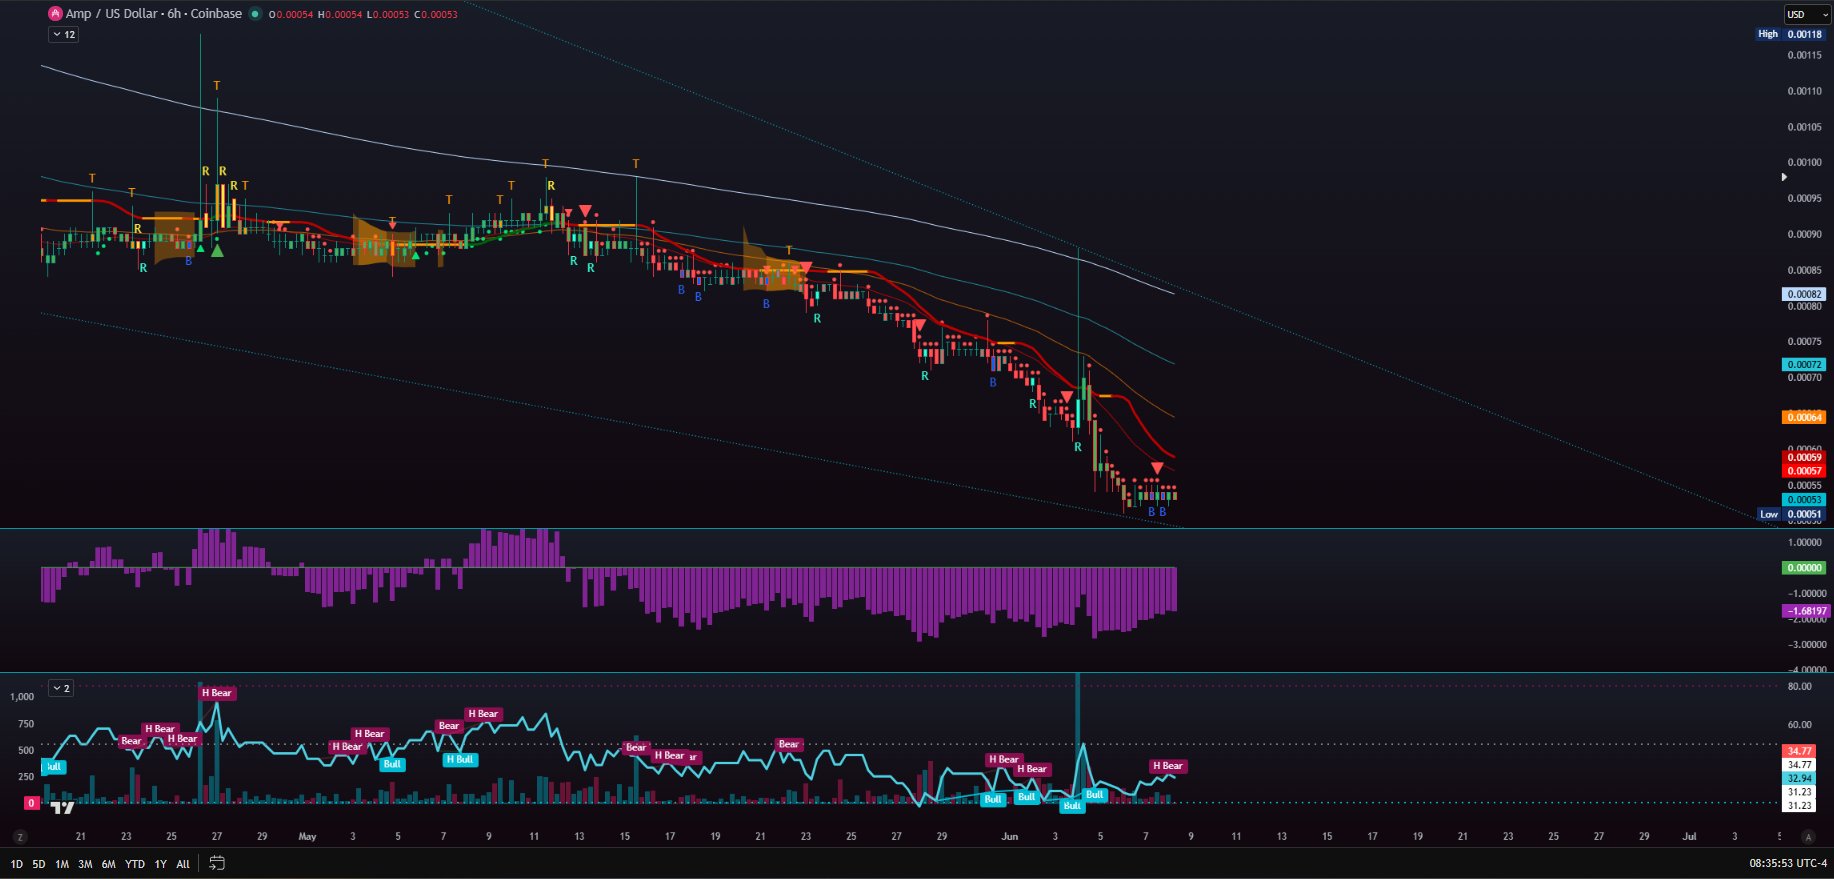
AMP chart shows a breakout above resistance, indicating significant upside potential.
0
0
0
2026-06-07 05:18
روند AMP پس از انتشار
صعودی
AMP chart shows a breakout above resistance, indicating significant upside potential.
پیشبینی قیمت
چه زمانی برای خرید AMP مناسب است؟ آیا اکنون باید AMP بخرم یا بفروشم؟
از دیدگاه تجزیه و تحلیل فنی بر اساس تحلیل تکنیکال 4 ساعته AMP، سیگنال معاملاتی نگهداری است. بر اساس تحلیل تکنیکال 1 روزه AMP، سیگنال معاملاتی نگهداری است.

پیشبینی Beacon
پیشبینی احتمالی قیمت (24 ساعت آینده)اطلاعیه
بازارهای پیشبینی ذاتاً نوسانپذیر هستند. قیمت واقعی تراکنش ممکن است با قیمت نمایش دادهشده متفاوت باشد و پرداخت نهایی طبق قوانین تسویه پلتفرم تعیین میشود.
درباره Amp
Amp (AMP) is a cryptocurrency launched in 2020and operates on the Ethereum platform. Amp has a current supply of 99,720,238,122.28571238 with 86,781,193,103.18022 in circulation. The last known price of Amp is 0.00053037 USD and is down -0.72 over the last 24 hours. It is currently trading on 188 active market(s) with $7,906,755.96 traded over the last 24 hours. More information can be found at https://amp.xyz.
بیشتر بخوانید


بخرید AMP
معامله AMP