🔔The End of an Era: ICON Network Confirms Shutdown Plan and Final @sodaholders Migration Schedule
The crypto landscape is evolving, and so are its pioneers. ICON has officially announced the final timeline for its historic transition to SODAX:
the ICON Network will be permanently halted on December 31, 2026.
https://t.co/vOrofQUpvQ
رشد کنید
Rewards
قرعهکشی روزانه
100% Chance To Win With Daily Trades
قرعهکشی روزانه اسپات
Win 8,888 USDT In Grand Prizes
افزایش اعتبار خط همراه
افزایش اعتبار خط همراه بهراحتی، آنلاین و ایمن
Send
Send money globally, fast and secure
BitMart Mall
Live on crypto

ICON (ICX)
$ 0.029 (ICX/USD)
0.00%
24H
ICON دادههای قیمت لحظهای
قیمت امروز ICON برابر با $ 0.029 (ICX/USD) است. با ارزش بازار برابر با $ 32.87M USD. حجم معاملات 24 ساعته $ 694.55K USD, تغییر قیمت 24 ساعته به میزان +0.00% و عرضه در گردش برابر با 1.10B ICX.
ICON ICX تاریخچه قیمت USD
قیمت ICON را برای امروز، 7 روز، 30 روز و 90 روز پیگیری کنید
دوره
تغییر
تغییر (%)
امروز
$ 0
0.00%
7روزها
$ 0
0.00%
30روزها
$ 0.0099
-25.00%
90روزها
$ 0.0099
-25.00%
تجارت ICX در سه مرحله
یک حساب کاربری رایگان ایجاد کنید، حساب خود را شارژ کنید، افزودن سپس ارز دیجیتال خود را انتخاب کنید
ICON اطلاعات بازار
$ 0.029 محدوده ۲۴ ساعته $ 0.029
بالاترین رکورد زمانی
$ 0.059
همیشه پایین
$ 0.029
تغییر ۲۴ ساعته
0.00%
حجم ۲۴ ساعت
$ 694,551.57
عرضه در گردش
1.09B
ICX
مارکت کپ
$ 32.87M
حداکثر عرضه
--
ارزش بازار کاملاً رقیقشده
$ 33.22M
معامله ICX
کسب درآمد حتی بدون دانش مالی
Put your idle crypto to work and earn passive income through savings, staking, and more.
ICON X Insight

Aalexxx™
Media
Researcher
C
 3.6K @Aaleks_crypt
 بسیار نزولی
ICON will shut down on December 31, 2026, and holders must migrate to SODA.
 2
2
 0
0
 28
28
2026-05-27 12:38
روند ICX پس از انتشار
نزولی
ICON will shut down on December 31, 2026, and holders must migrate to SODA.

吴说区块链
Media
Educator
D
177.6K @wublockchain12 بسیار نزولی
ICX will shut down its network on December 31, 2026 and migrate to SODA, outlook bleak
South Korea's veteran public chain ICON announced that it will officially shut down its network on December 31, 2026, and complete the migration to SODAX. The official stated that the final migration deadline from ICX to SODA is also December 31, 2026, after which ICX will no longer be able to migrate. ICON said that as cross-chain and liquidity infrastructure mature, maintaining the Layer 1 no longer aligns with the project's direction. https://t.co/cqZvbnvoT2
2
2
2.9K
2026-05-25 14:56
روند ICX پس از انتشار
نزولی
ICX will shut down its network on December 31, 2026 and migrate to SODA, outlook bleak

Crypto Patel
TA_Analyst
OnChain_Analyst
B
60.9K @CryptoPatel نزولی
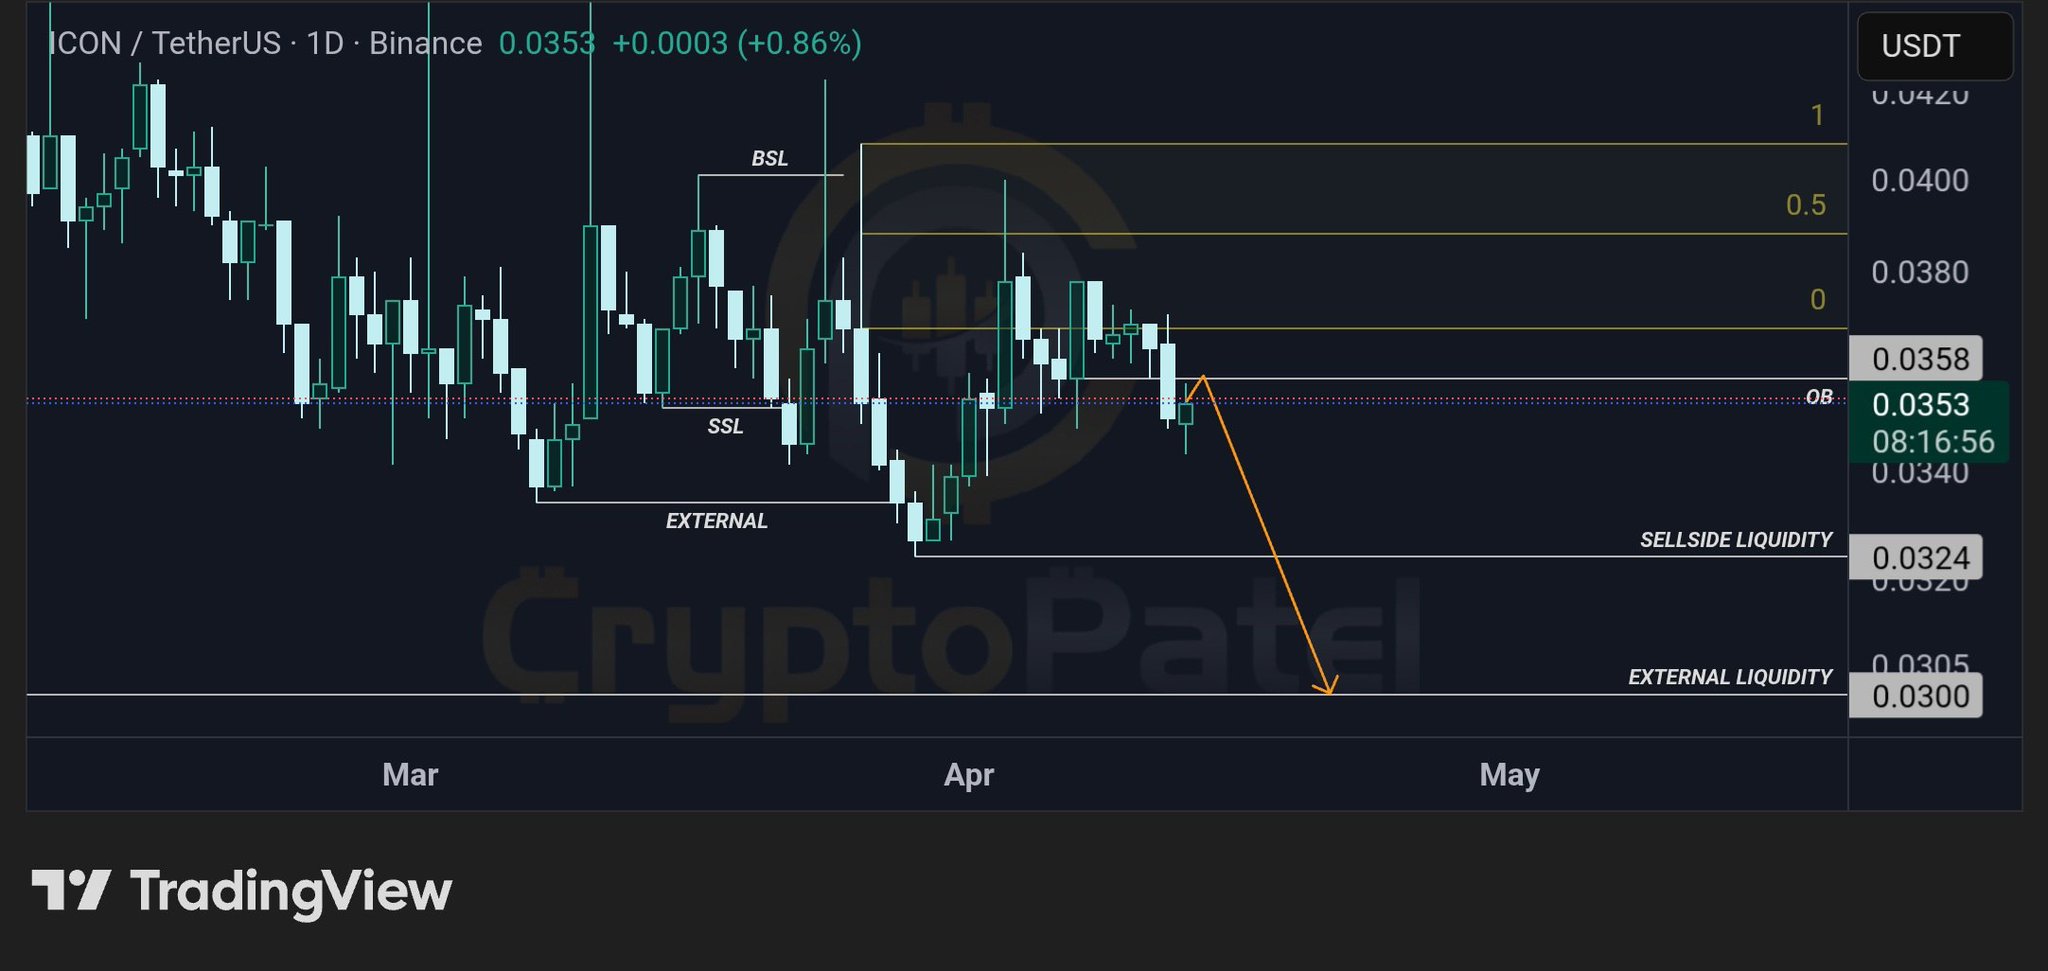
ICX technical outlook shows weakness, expected to continue falling to $0.0324‑$0.0300.
$ICX/USDT 1D SETUP | BEARISH CONTINUATION TOWARD SELL-SIDE LIQUIDITY
#ICX is reacting from a higher timeframe order block in a premium zone, showing weak bullish continuation and signs of distribution, favoring downside continuation toward liquidity below.
Technical Structure:
✅ Daily Order Block → strong resistance in premium zone
✅ Prior rejection → bearish intent confirmed
✅ Weak bullish continuation → distribution behavior
✅ HTF bearish structure forming
✅ Liquidity below → clear downside targets
Targets: $0.0324 → $0.0300
Invalidation: 1D close above $0.0387
Bearish bias. Wait for minor pullback / rejection inside OB and confirmation before entering toward sell-side liquidity.
TA Only. DYOR.
 230
11
5.7K
230
11
5.7K
2026-04-14 05:33
روند ICX پس از انتشار
بسیار نزولی
ICX technical outlook shows weakness, expected to continue falling to $0.0324‑$0.0300.
پیشبینی قیمت
چه زمانی برای خرید ICX مناسب است؟ آیا اکنون باید ICX بخرم یا بفروشم؟
از دیدگاه تجزیه و تحلیل فنی بر اساس تحلیل تکنیکال 4 ساعته ICX، سیگنال معاملاتی نگهداری است. بر اساس تحلیل تکنیکال 1 روزه ICX، سیگنال معاملاتی نگهداری است.

پیشبینی Beacon
پیشبینی احتمالی قیمت (24 ساعت آینده)اطلاعیه
بازارهای پیشبینی ذاتاً نوسانپذیر هستند. قیمت واقعی تراکنش ممکن است با قیمت نمایش دادهشده متفاوت باشد و پرداخت نهایی طبق قوانین تسویه پلتفرم تعیین میشود.
درباره ICON
ICON (ICX) is a cryptocurrency . ICON has a current supply of 1,108,792,174.2180953 with 1,097,115,985.7391582 in circulation. The last known price of ICON is 0.02879669 USD and is down -0.90 over the last 24 hours. It is currently trading on 168 active market(s) with $1,351,520.55 traded over the last 24 hours. More information can be found at https://icon.community.
بیشتر بخوانید