The next bottleneck being solved is water.
Liquid cooling is reducing water consumption dramatically, removing another constraint on AI infrastructure growth.
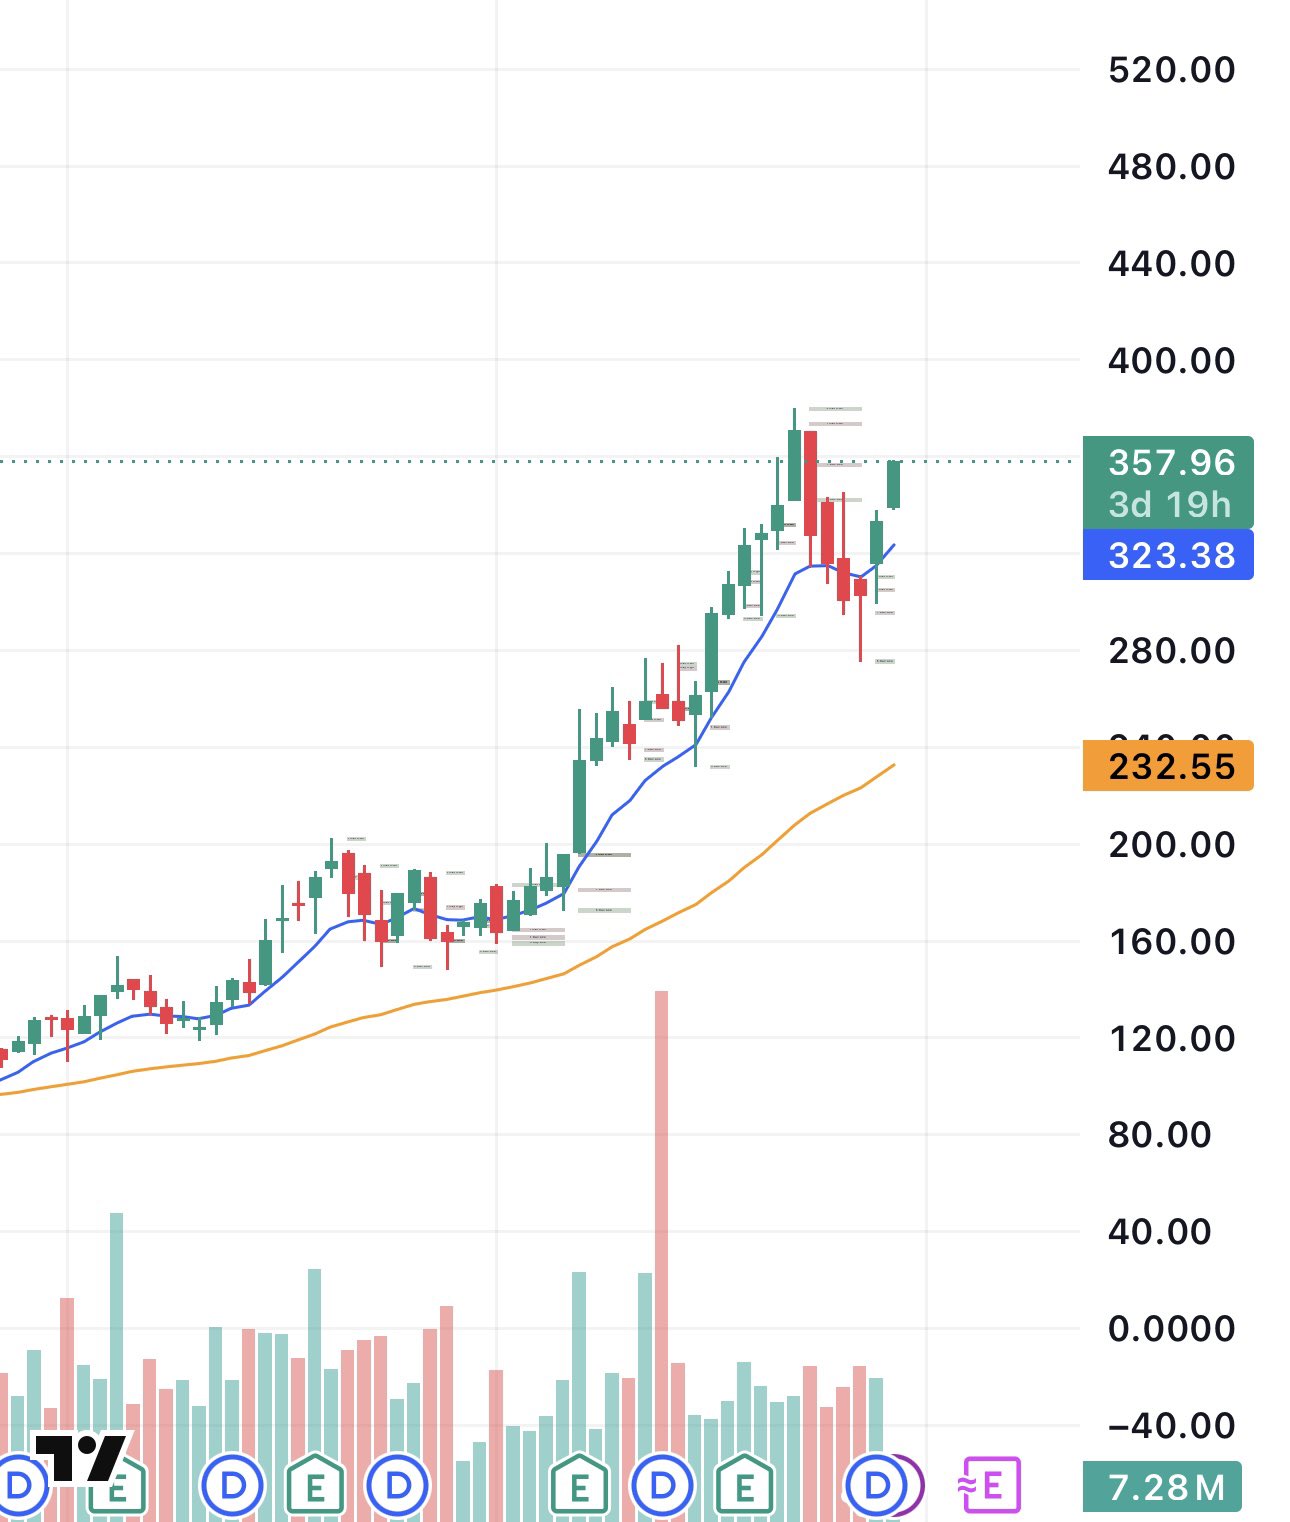
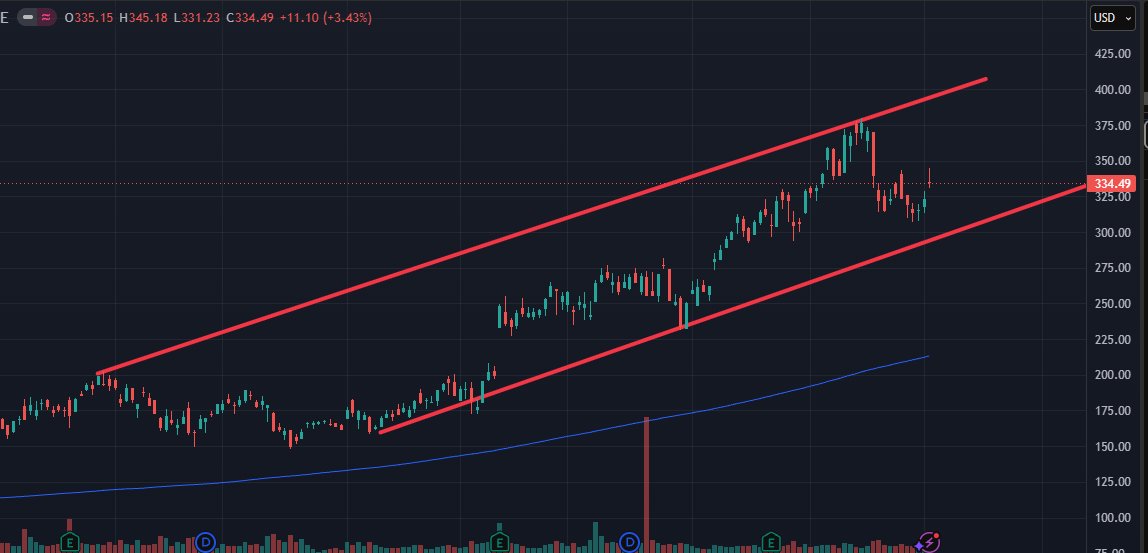
That’s why names like $VRT continue to interest me.
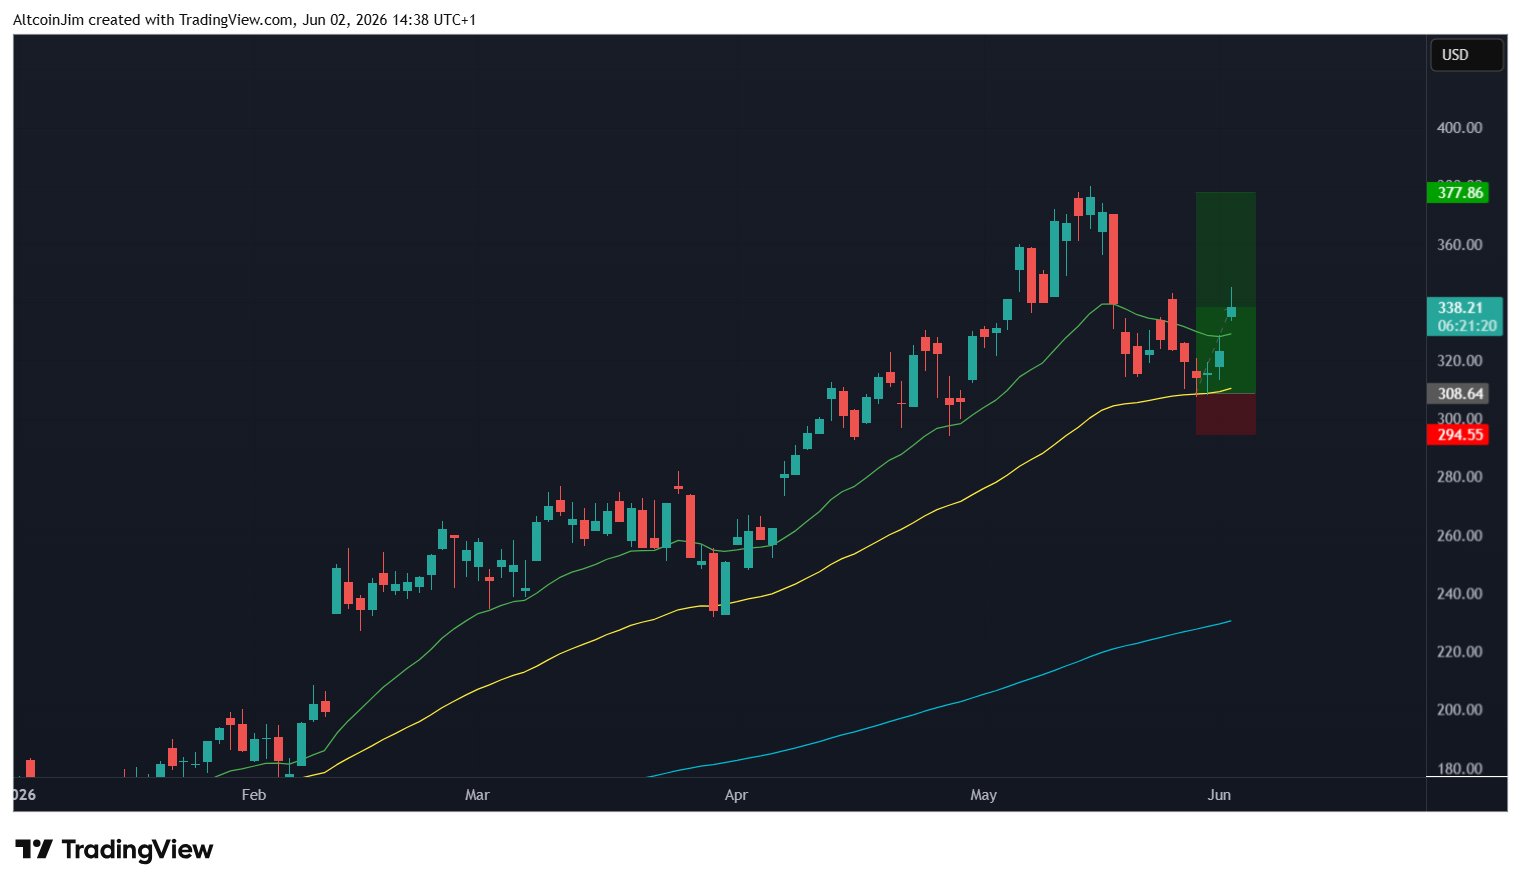
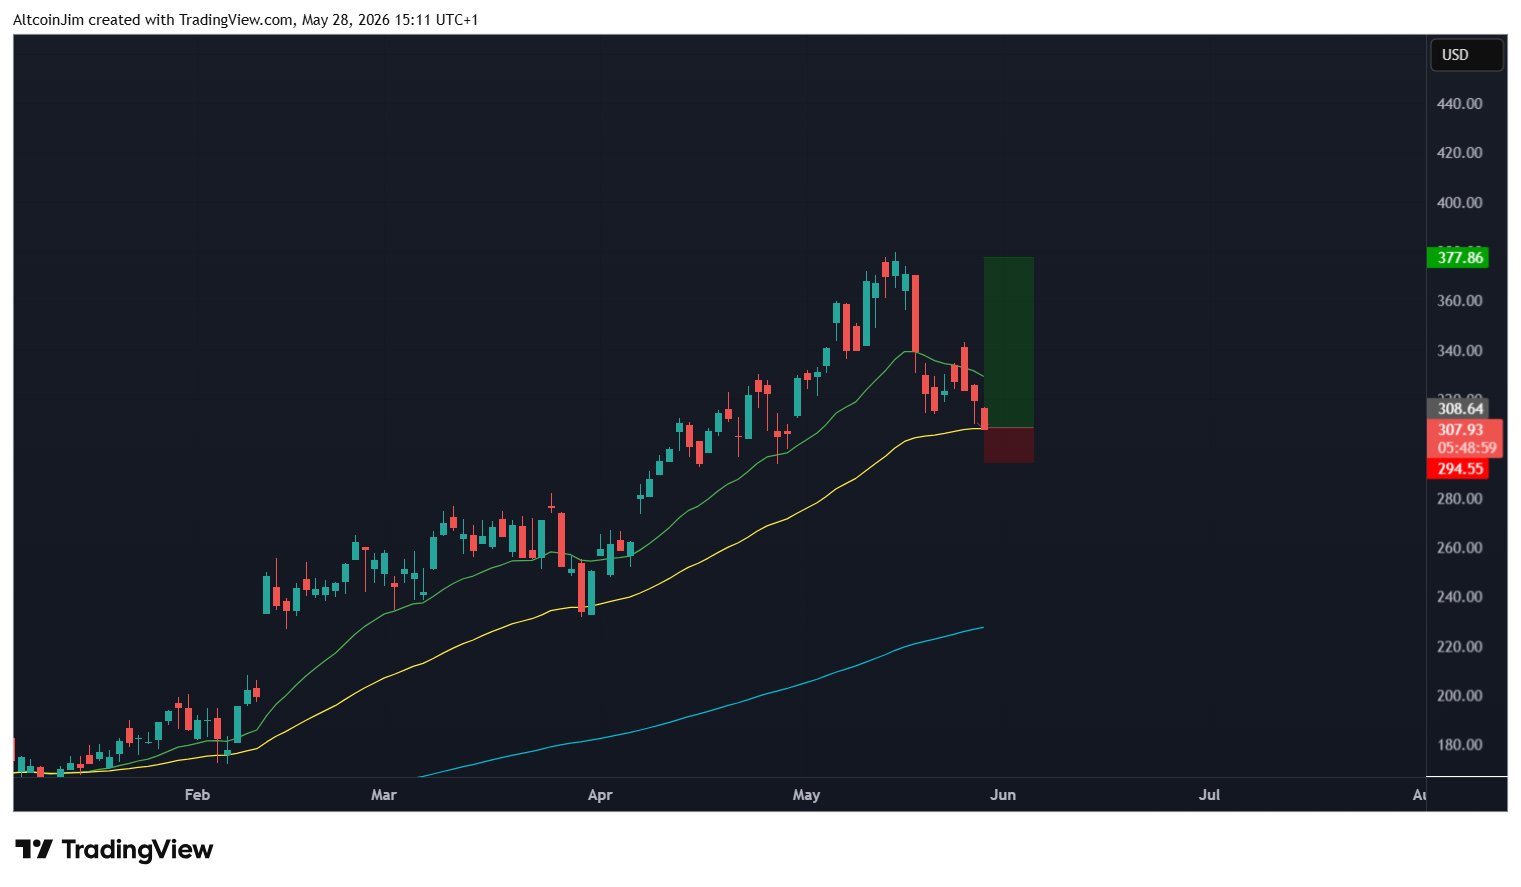
Printed a higher low on both the daily and weekly. Momentum is building and it looks ready to make a run at new all-time highs above $380.
Follow the bottlenecks. Follow the leaders.