
Woke up to my neighbor’s rooster at 5:12 AM, immediately checked charts on my cracked Android while chain-smoking on the porch steps.
My “retirement plan” is just more sats and prayer.
Family thinks I’m gambling again.
Bitcoin’s turning this broke-ass bloodline around while they still argue over who gets grandma’s broken riding mower.
Acheter des cryptomonnaies
carte
P2P Trading
Achetez des USDT sur la marketplace
Carte bancaire
Achetez des cryptomonnaies avec une carte Visa ou Mastercard
Paiement par un tiers
Buy des crypto via MoonPay, Simplex et plus
BitMart Card
Dynamisez vos investissements dans les cryptos
Carte prépayée crypto
Obtenez instantanément une Mastercard prête à l'emploi
Échanger
Spot
Négociez des cryptomonnaies rapidement et de manière professionnelle
BM Discovery
La plateforme de découverte d'actifs On-Chain la plus rapide
DEX
bêta
La solution la plus simple pour trader en chaîne.
Marge
5x
Augmentez vos profits grâce à l'effet de levier
Pré-marché
Planifiez à l'avance, saisissez l'opportunité
USDⓈ-M
En utilisant USDⓈ comme garantie
COIN-M
Utiliser la cryptomonnaie elle-même comme garantie
TradFi
Un guichet unique pour les métaux, les actions et le forex
Démo de trading
Apprenez à trade sans risque
Aperçu des contrats à terme
Une plateforme unique pour tout ce qui concerne les contrats à terme
Futures King
Cagnotte de 478 000 USDT
Augmenter
Aperçu des gains
Actifs inactifs, obtenez des rendements en toute simplicité
Épargne
Gagnez des intérêts grâce à vos avoirs.
Staking
Staking facile, récompenses élevées
Gestion de patrimoine
Développez votre patrimoine avec une équipe d'actifs de premier ordre Top
RWA
Conservez le BMRUSD et profitez du rendement
Offre exclusive pour les VIP
Gagner en toute sécurité pour les utilisateurs VIP
Rewards
Centre de récompenses
Découvrez des récompenses exclusives d'une valeur allant jusqu'à 14 000 USDT
Lancement Prime
Une plateforme de lancement de jetons et NFT
Programme d'affiliation
Rejoignez-nous pour profiter de commissions élevées
Powerdrop
La solution airdrop de nouvelle génération est DISPONIBLE !
Centre des événements
Le guichet unique pour toutes les opérations commerciales
Tirage au sort quotidien futures
100% de chances de gagner avec les tradings quotidiens
Tirage quotidien Spot
Gagnez 8 888 USDT en grands prix
Staker pour voter
Gagnez des airdrops en votant
Institution
Des services professionnels et exclusifs
VIP
Débloquez des récompenses exclusives
Académie
Tout ce que vous devez savoir sur le trading et la blockchain.
Stage chez BitMart
Commencez votre carrière en crypto ici
Bitmart Travel
Services de voyage mondiaux One-Stop
INO
Une plateforme de lancement de NFT
Stake BMX pour le listing
Partager les frais de transaction
APIS
Une stabilité fiable et de nombreux points de terminaison
Programme de courtier
Gagnez des commissions grâce à l'intégration d'API
Actualités
Dernières actualités et derniers points de vue
MARKETPLACE NFT
Une marketplace NFT unique en son genre
Recharge mobile Top
Rechargez vos téléphones portables facilement, online, en toute sécurité
Send
Send money globally, fast and secure
BitMart Mall
Événement en direct sur les cryptomonnaies
Bullish Trump Coin BTC Historique des prix USD
Suivez le prix de Bullish Trump Coin aujourd’hui, dans 7 jours, 30 jours et 90 jours
Période
Modifier
Variation (en pourcentage)
Aujourd'hui
$ 271.51
-0.42%
7Jours
$ 1,754.14
-2.67%
30Jours
$ 13,597.09
-17.54%
90Jours
$ 3,862.36
-5.70%
Possédez BTC dès maintenant
Achetez et vendez BTC facilement et en toute sécurité sur BitMart.
Bullish Trump Coin Informations sur le marché
$ 63,215.84 Fourchette de prix sur 24 heures $ 64,513.95
Record absolu
$ 126,065.76
Plus bas niveau jamais atteint
$ 631.33
Variation sur 24 heures
-0.31%
Volume sur 24 h
$ 126,973,430.31
Approvisionnement en circulation
20.04M
BTC
Capitalisation boursière
$ 1.28T
Approvisionnement maximal
21.00M
BTC
Capitalisation boursière entièrement diluée
$ 1.34T
Trader BTC
Gagner
Faites fructifier vos cryptomonnaies et générez des revenus passifs grâce à l'épargne, au staking, et plus encore.
Bullish Trump Coin X Insight

Adam Livingston
FA_Analyst
Influencer
A
 82.9K @AdamBLiv
 Haussier
Bitcoin helps families turn things around, outlook looks positive
 0
0
 0
0
 143
143
2026-06-22 00:33
Tendance de BTC après le lancement
Haussier
Bitcoin helps families turn things around, outlook looks positive

The Bitcoin Historian
Media
Influencer
C
214.8K @pete_rizzo_ Extrêmement haussier
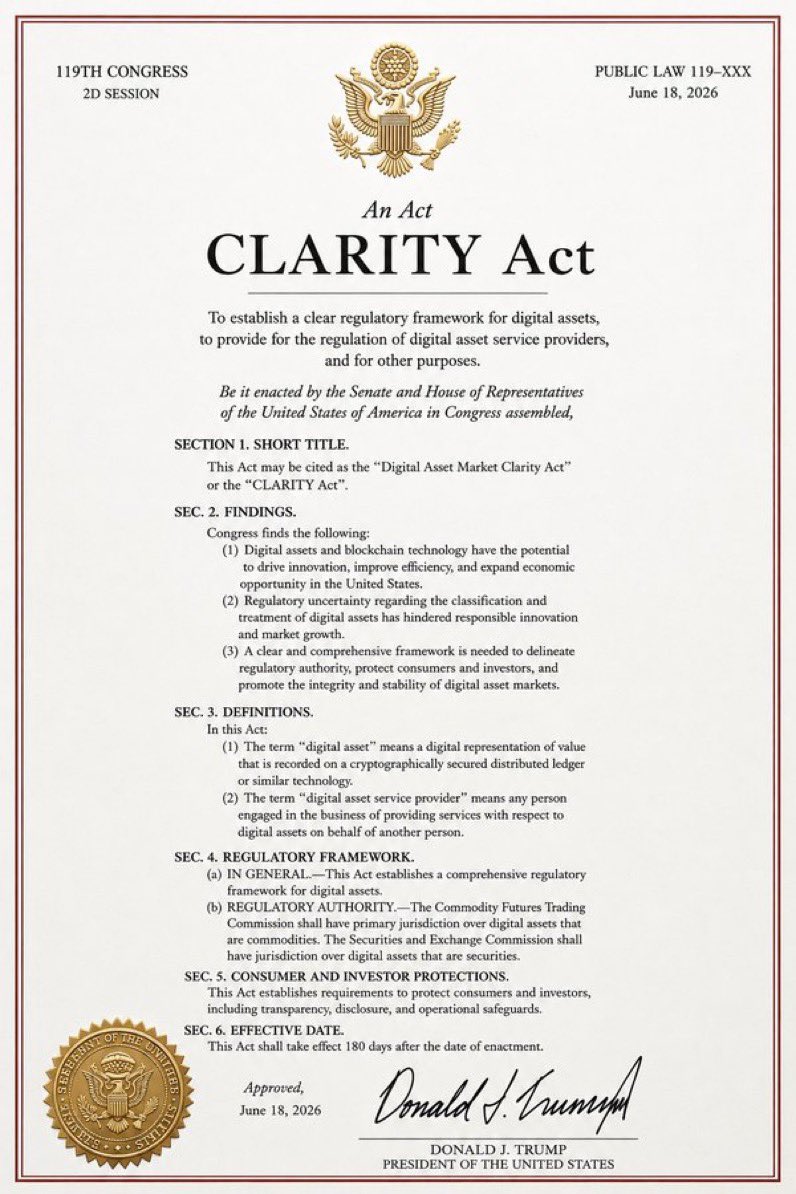
The US Senate will finalize the Crypto Clarity Act, bringing regulatory clarity to the digital asset market.
The Bitcoin Historian
Media
Influencer
C
214.8K @pete_rizzo_ LATEST: US SENATE WILL MEET TO FINALIZE THE #BITCOIN AND CRYPTO CLARITY ACT THIS WEEK
LIKE, IF YOU WANT TRUMP TO SIGN THIS BILL IMMEDIATELY 🔥 https://t.co/tLioaF8GIW
 35
2
2.6K
35
2
2.6K
2026-06-22 00:32
Tendance de BTC après le lancement
Extrêmement haussier
The US Senate will finalize the Crypto Clarity Act, bringing regulatory clarity to the digital asset market.

吴说区块链
Media
Educator
D
177.6K @wublockchain12 Extrêmement baissier
A large amount of short positions indicate a pessimistic outlook on BTC, SOL, and ETH.
According to monitoring by Onchain Lens, the newly created wallet 0xaea deposited 6.68 million USDC into Hyperliquid and opened short positions with 20× leverage, including 430.64 BTC (approximately $27 million), 181,245 SOL (approximately $13 million) and 4,280 ETH (approximately $7 million).
https://t.co/J6xgKkXdXQ
0
0
359
2026-06-22 00:32
Tendance de BTC après le lancement
Baissier
A large amount of short positions indicate a pessimistic outlook on BTC, SOL, and ETH.
Prévision de prix
Quel est le meilleur moment pour acheter BTC? Dois-je acheter ou vendre BTC maintenant ?
Pour déterminer s'il est opportun d'acheter ou de vendre Bullish Trump Coin (BTC), il est important de commencer par s'aligner sur sa propre stratégie de trading et son profil de risque. Les investisseurs à long terme et les traders à court terme interprètent souvent les conditions du marché différemment, votre décision doit donc refléter votre approche personnelle. Selon la dernière analyse technique BTC sur 1 jour, le signal actuel est Tenez.

Prédiction de Beacon
Prévision probabiliste des prix (Prochaines 24 heures)Avertissement de prédiction de Beacon
Les résultats affichés sur cette page sont analysés sur la base des données de trading réelles (OHLCV) de la paire de trading sélectionnée ainsi que des indicateurs techniques correspondants.
Cette prédiction est un produit technique expérimental et est fournie uniquement à titre de référence. Ceci ne constitue pas un conseil en investissement. Des événements inattendus du monde réel peuvent avoir un impact significatif sur le comportement du marché. Les traders doivent prendre des décisions avec prudence.
Cette prédiction est un produit technique expérimental et est fournie uniquement à titre de référence. Ceci ne constitue pas un conseil en investissement. Des événements inattendus du monde réel peuvent avoir un impact significatif sur le comportement du marché. Les traders doivent prendre des décisions avec prudence.
Q&R
How Many Bitcoins Are There?
How Much Is Bitcoin Today?
What Is Bitcoin Mining?
À propos Bullish Trump Coin
Bitcoin (BTC) is a digital asset and a payment system invented by Satoshi Nakamoto who published a related paper in 2008 and released it as open-source software in 2009. The system featured as peer-to-peer; users can transact directly without an intermediary. Transactions are verified by network nodes and recorded in a public distributed ledger called the blockchain. The ledger uses bitcoin as its unit of account. The system works without a central repository or single administrator, which has led the U.S. Treasury to categorize bitcoin as a decentralized virtual currency. Bitcoin is often called the first cryptocurrency, although prior systems existed. Bitcoin is more correctly described as the first decentralized digital currency. It is the largest of its kind in terms of total market value by now.
En savoir plus
Liens officiels
Réseaux sociaux


Acheter BTC
Trader BTC