Acheter des cryptomonnaies
carte
P2P Trading
Achetez des USDT sur la marketplace
Carte bancaire
Achetez des cryptomonnaies avec une carte Visa ou Mastercard
Paiement par un tiers
Buy des crypto via MoonPay, Simplex et plus
BitMart Card
Dynamisez vos investissements dans les cryptos
Carte prépayée crypto
Obtenez instantanément une Mastercard prête à l'emploi
Échanger
Spot
Négociez des cryptomonnaies rapidement et de manière professionnelle
BM Discovery
La plateforme de découverte d'actifs On-Chain la plus rapide
DEX
bêta
La solution la plus simple pour trader en chaîne.
Marge
5x
Augmentez vos profits grâce à l'effet de levier
Pré-marché
Planifiez à l'avance, saisissez l'opportunité
USDⓈ-M
En utilisant USDⓈ comme garantie
COIN-M
Utiliser la cryptomonnaie elle-même comme garantie
TradFi
Un guichet unique pour les métaux, les actions et le forex
Démo de trading
Apprenez à trade sans risque
Aperçu des contrats à terme
Une plateforme unique pour tout ce qui concerne les contrats à terme
Futures King
Cagnotte de 478 000 USDT
Augmenter
Aperçu des gains
Actifs inactifs, obtenez des rendements en toute simplicité
Épargne
Gagnez des intérêts grâce à vos avoirs.
Staking
Staking facile, récompenses élevées
Gestion de patrimoine
Développez votre patrimoine avec une équipe d'actifs de premier ordre Top
RWA
Conservez le BMRUSD et profitez du rendement
Offre exclusive pour les VIP
Gagner en toute sécurité pour les utilisateurs VIP
Rewards
Centre de récompenses
Découvrez des récompenses exclusives d'une valeur allant jusqu'à 14 000 USDT
Lancement Prime
Une plateforme de lancement de jetons et NFT
Programme d'affiliation
Rejoignez-nous pour profiter de commissions élevées
Powerdrop
La solution airdrop de nouvelle génération est DISPONIBLE !
Centre des événements
Le guichet unique pour toutes les opérations commerciales
Tirage au sort quotidien futures
100% de chances de gagner avec les tradings quotidiens
Tirage quotidien Spot
Gagnez 8 888 USDT en grands prix
Staker pour voter
Gagnez des airdrops en votant
Institution
Des services professionnels et exclusifs
VIP
Débloquez des récompenses exclusives
Académie
Tout ce que vous devez savoir sur le trading et la blockchain.
Stage chez BitMart
Commencez votre carrière en crypto ici
Bitmart Travel
Services de voyage mondiaux One-Stop
INO
Une plateforme de lancement de NFT
Stake BMX pour le listing
Partager les frais de transaction
APIS
Une stabilité fiable et de nombreux points de terminaison
Programme de courtier
Gagnez des commissions grâce à l'intégration d'API
Actualités
Dernières actualités et derniers points de vue
MARKETPLACE NFT
Une marketplace NFT unique en son genre
Recharge mobile Top
Rechargez vos téléphones portables facilement, online, en toute sécurité
Send
Send money globally, fast and secure
BitMart Mall
Événement en direct sur les cryptomonnaies

Peezy 0x69 (PEEZY)
$ 0.00000041 (PEEZY/USD)
-3.91%
24H
Peezy 0x69 Données sur les prix en temps réel
Le prix de Peezy 0x69 aujourd'hui est $ 0.00000041 (PEEZY/USD). Avec une capitalisation boursière de $ 127.41K USD. Volume de trading de $ 3,049.41 USD sur 24 heures, Un changement de prix de -3.91% sur 24 heures, Et une réserve circulante de 305.65B PEEZY.
Peezy 0x69 PEEZY Historique des prix USD
Suivez le prix de Peezy 0x69 aujourd’hui, dans 7 jours, 30 jours et 90 jours
Période
Modifier
Variation (en pourcentage)
Aujourd'hui
$ 0.000000016
-3.91%
7Jours
$ 0.000000052
-10.74%
30Jours
$ 0.00000023
-34.95%
90Jours
$ 0.000000035
-7.50%
Possédez PEEZY dès maintenant
Achetez et vendez PEEZY facilement et en toute sécurité sur BitMart.
Peezy 0x69 Informations sur le marché
$ 0.00000039 Fourchette de prix sur 24 heures $ 0.00000043
Record absolu
$ 0.00000094
Plus bas niveau jamais atteint
$ 0.00000018
Variation sur 24 heures
-3.91%
Volume sur 24 h
$ 3,049.41
Approvisionnement en circulation
305.65B
PEEZY
Capitalisation boursière
$ 127.41K
Approvisionnement maximal
420.69B
PEEZY
Capitalisation boursière entièrement diluée
$ 175.36K
Trader PEEZY
Gagner
Faites fructifier vos cryptomonnaies et générez des revenus passifs grâce à l'épargne, au staking, et plus encore.
Peezy 0x69 X Insight

davie satoshi
TA_Analyst
NFT_Expert
B
 27.3K @NFTdavie
 Haussier
PEEZY technical analysis shows two paths: bullish if support holds, bearish if it breaks.
davie satoshi
TA_Analyst
NFT_Expert
B
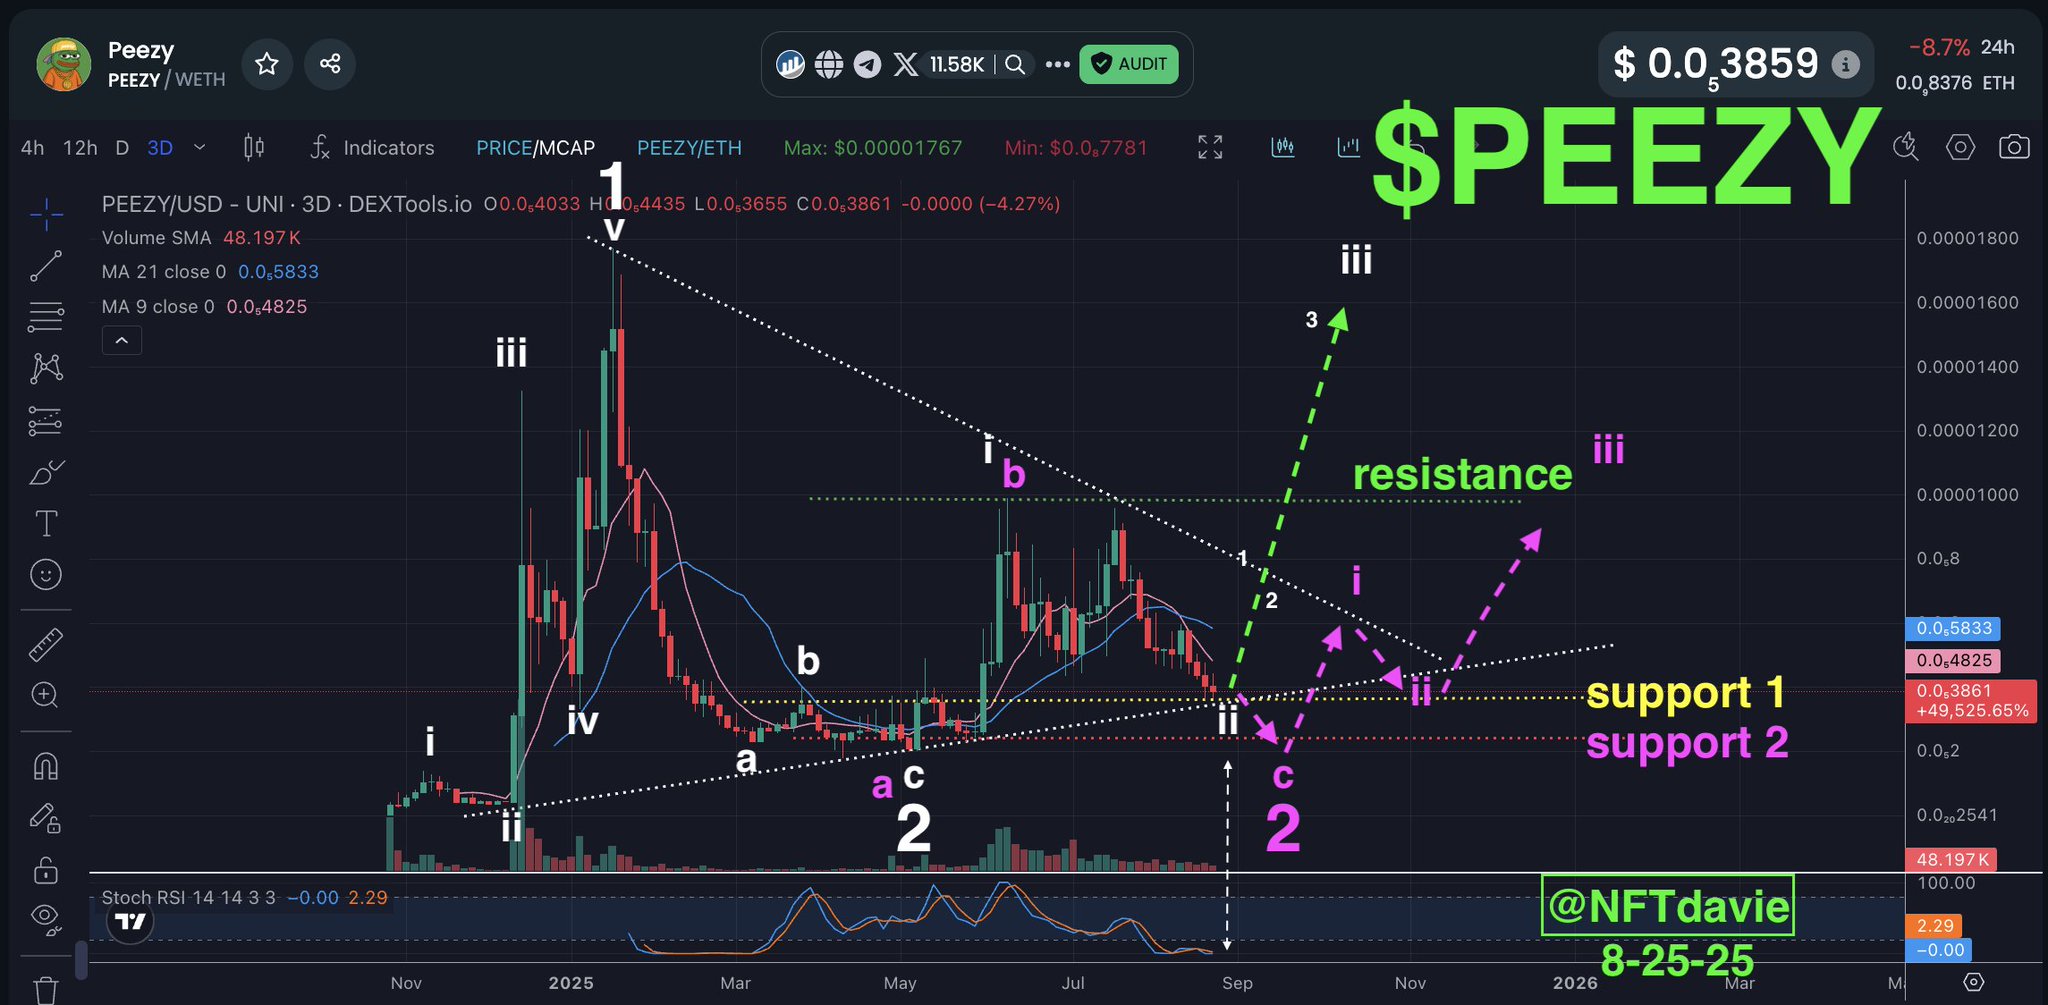
27.3K @NFTdavie Rapid Fire Charts: $PEEZY
PEEZY has many possible routes but here are the two likely routes IMO.
Bullish - GREEN/WHITE - In this scenario, major wave 2 has completed in spring of 2025 and the subsequent waves afterwards are part of major wave 3. We can make out a subwave i of 3 (labeled white i) and wave ii of 3 looks about complete (white ii where we are currently). There are two major support lines here (yellow/white) intersecting which should be strong. That should lead to a bounce here and the beginning of wave iii of 3.
Bearish - PINK - In this scenario, major wave 2 has not completed and $PEEZY is a laggard in the altcoin/memecoin trend. If it falls below the two intersecting support line (yellow and white), then it will fall onto the next one (pink). This does correspond better with the historic low stoch RSI reading on the 3 day chart as the low readings tend to correlate to major wave 2's. In this scenario, the climb back up begins with sub wave i and so forth. This scenario paints a picture of th
 42
42
 13
13
 2.8K
2.8K
2025-08-28 19:24
Tendance de PEEZY après le lancement
Haussier
PEEZY technical analysis shows two paths: bullish if support holds, bearish if it breaks.

Jools
Dev
Influencer
B
20.1K @jewelsindefi Haussier
Predicting that ETH's rise will lead to buying interest for PEEZY.
When $ETH goes crazy, long standing communities like $PEEZY will eventually catch a bid.
Peezy money.
39
7
1.4K
2025-08-28 13:13
Tendance de PEEZY après le lancement
Haussier
Predicting that ETH's rise will lead to buying interest for PEEZY.
davie satoshi
TA_Analyst
NFT_Expert
B
27.3K @NFTdavie Neutre
PEEZY technical analysis shows two paths: bullish if support holds, bearish if it breaks.
Rapid Fire Charts: $PEEZY
PEEZY has many possible routes but here are the two likely routes IMO.
Bullish - GREEN/WHITE - In this scenario, major wave 2 has completed in spring of 2025 and the subsequent waves afterwards are part of major wave 3. We can make out a subwave i of 3 (labeled white i) and wave ii of 3 looks about complete (white ii where we are currently). There are two major support lines here (yellow/white) intersecting which should be strong. That should lead to a bounce here and the beginning of wave iii of 3.
Bearish - PINK - In this scenario, major wave 2 has not completed and $PEEZY is a laggard in the altcoin/memecoin trend. If it falls below the two intersecting support line (yellow and white), then it will fall onto the next one (pink). This does correspond better with the historic low stoch RSI reading on the 3 day chart as the low readings tend to correlate to major wave 2's. In this scenario, the climb back up begins with sub wave i and so forth. This scenario paints a picture of th
42
13
2.8K
2025-08-25 16:15
Tendance de PEEZY après le lancement
Neutre
PEEZY technical analysis shows two paths: bullish if support holds, bearish if it breaks.
Prévision de prix
Quel est le meilleur moment pour acheter PEEZY? Dois-je acheter ou vendre PEEZY maintenant ?
Pour déterminer s'il est opportun d'acheter ou de vendre Peezy 0x69 (PEEZY), il est important de commencer par s'aligner sur sa propre stratégie de trading et son profil de risque. Les investisseurs à long terme et les traders à court terme interprètent souvent les conditions du marché différemment, votre décision doit donc refléter votre approche personnelle. Selon la dernière analyse technique PEEZY de 4 heures, le signal de trading actuel est Acheter. Selon la dernière analyse technique PEEZY sur 1 jour, le signal actuel est Tenez.

Prédiction de Beacon
Prévision probabiliste des prix (Prochaines 24 heures)Avertissement de prédiction de Beacon
Les résultats affichés sur cette page sont analysés sur la base des données de trading réelles (OHLCV) de la paire de trading sélectionnée ainsi que des indicateurs techniques correspondants.
Cette prédiction est un produit technique expérimental et est fournie uniquement à titre de référence. Ceci ne constitue pas un conseil en investissement. Des événements inattendus du monde réel peuvent avoir un impact significatif sur le comportement du marché. Les traders doivent prendre des décisions avec prudence.
Cette prédiction est un produit technique expérimental et est fournie uniquement à titre de référence. Ceci ne constitue pas un conseil en investissement. Des événements inattendus du monde réel peuvent avoir un impact significatif sur le comportement du marché. Les traders doivent prendre des décisions avec prudence.
À propos Peezy 0x69
Peezy 0x69 (PEEZY) is a cryptocurrency launched in 2024and operates on the Ethereum platform. Peezy 0x69 has a current supply of 359,709,061,786 with 305,650,329,936 in circulation. The last known price of Peezy 0x69 is 0.00000046 USD and is down -0.35 over the last 24 hours. It is currently trading on 10 active market(s) with $3,606.92 traded over the last 24 hours. More information can be found at https://peezy.vip/.
En savoir plus
Liens officiels
Chain Explorer
En savoir plus
BM Discovery


Nouvelle annonce

NES Nesa
-- 0.00%

HIVEON HIVE Digital Technologies
-- 0.00%

SOXSON Direxion Daily Semi Bear 3X ETF
-- 0.00%

TON AT&T Tokenized Stock (Ondo)
-- 0.00%

KEELON Keel Infrastructure
-- 0.00%

DRAMON Roundhill Memory ETF
-- 0.00%

JAM JAM Coin
-- 0.00%

UMXM Manadia
-- 0.00%

UMCON United Microelectronics Tokenized Stock (Ondo)
-- 0.00%

AMKRON Amkor Technology Tokenized Stock (Ondo)
-- 0.00%