Acheter des cryptomonnaies
carte
P2P Trading
Achetez des USDT sur la marketplace
Carte bancaire
Achetez des cryptomonnaies avec une carte Visa ou Mastercard
Paiement par un tiers
Buy des crypto via MoonPay, Simplex et plus
BitMart Card
Dynamisez vos investissements dans les cryptos
Carte prépayée crypto
Obtenez instantanément une Mastercard prête à l'emploi
Échanger
Spot
Négociez des cryptomonnaies rapidement et de manière professionnelle
BM Discovery
La plateforme de découverte d'actifs On-Chain la plus rapide
DEX
bêta
La solution la plus simple pour trader en chaîne.
Marge
5x
Augmentez vos profits grâce à l'effet de levier
Pré-marché
Planifiez à l'avance, saisissez l'opportunité
USDⓈ-M
En utilisant USDⓈ comme garantie
COIN-M
Utiliser la cryptomonnaie elle-même comme garantie
TradFi
Un guichet unique pour les métaux, les actions et le forex
Démo de trading
Apprenez à trade sans risque
Aperçu des contrats à terme
Une plateforme unique pour tout ce qui concerne les contrats à terme
Futures King
Cagnotte de 478 000 USDT
Augmenter
Aperçu des gains
Actifs inactifs, obtenez des rendements en toute simplicité
Épargne
Gagnez des intérêts grâce à vos avoirs.
Staking
Staking facile, récompenses élevées
Gestion de patrimoine
Développez votre patrimoine avec une équipe d'actifs de premier ordre Top
RWA
Conservez le BMRUSD et profitez du rendement
Offre exclusive pour les VIP
Gagner en toute sécurité pour les utilisateurs VIP
Rewards
Centre de récompenses
Découvrez des récompenses exclusives d'une valeur allant jusqu'à 14 000 USDT
Lancement Prime
Une plateforme de lancement de jetons et NFT
Programme d'affiliation
Rejoignez-nous pour profiter de commissions élevées
Powerdrop
La solution airdrop de nouvelle génération est DISPONIBLE !
Centre des événements
Le guichet unique pour toutes les opérations commerciales
Tirage au sort quotidien futures
100% de chances de gagner avec les tradings quotidiens
Tirage quotidien Spot
Gagnez 8 888 USDT en grands prix
Staker pour voter
Gagnez des airdrops en votant
Institution
Des services professionnels et exclusifs
VIP
Débloquez des récompenses exclusives
Académie
Tout ce que vous devez savoir sur le trading et la blockchain.
Stage chez BitMart
Commencez votre carrière en crypto ici
Bitmart Travel
Services de voyage mondiaux One-Stop
INO
Une plateforme de lancement de NFT
Stake BMX pour le listing
Partager les frais de transaction
APIS
Une stabilité fiable et de nombreux points de terminaison
Programme de courtier
Gagnez des commissions grâce à l'intégration d'API
Actualités
Dernières actualités et derniers points de vue
MARKETPLACE NFT
Une marketplace NFT unique en son genre
Recharge mobile Top
Rechargez vos téléphones portables facilement, online, en toute sécurité
Send
Send money globally, fast and secure
BitMart Mall
Événement en direct sur les cryptomonnaies

ServiceNow Inc (Derivatives) (NOW)
$ 90.24 (NOW/USD)
-2.69%
24H
ServiceNow Inc (Derivatives) NOW Historique des prix USD
Suivez le prix de ServiceNow Inc (Derivatives) aujourd’hui, dans 7 jours, 30 jours et 90 jours
Période
Modifier
Variation (en pourcentage)
Aujourd'hui
$ 2.50
-2.69%
7Jours
$ 5.26
-5.54%
30Jours
$ 22.15
-19.79%
90Jours
$ 22.15
-19.79%
Possédez NOW dès maintenant
Achetez et vendez NOW facilement et en toute sécurité sur BitMart.
ServiceNow Inc (Derivatives) Informations sur le marché
$ 88.41 Fourchette de prix sur 24 heures $ 92.74
Record absolu
$ 115.24
Plus bas niveau jamais atteint
$ 88.41
Variation sur 24 heures
-2.69%
Volume sur 24 h
$ 0
Approvisionnement en circulation
0.00
NOW
Capitalisation boursière
$ 0
Approvisionnement maximal
--
Capitalisation boursière entièrement diluée
$ 0
Trader NOW
Gagner
Faites fructifier vos cryptomonnaies et générez des revenus passifs grâce à l'épargne, au staking, et plus encore.
ServiceNow Inc (Derivatives) X Insight

Zachary Markovich
TA_Analyst
Trader
B
 23.6K @Zac_Markovich
 Haussier
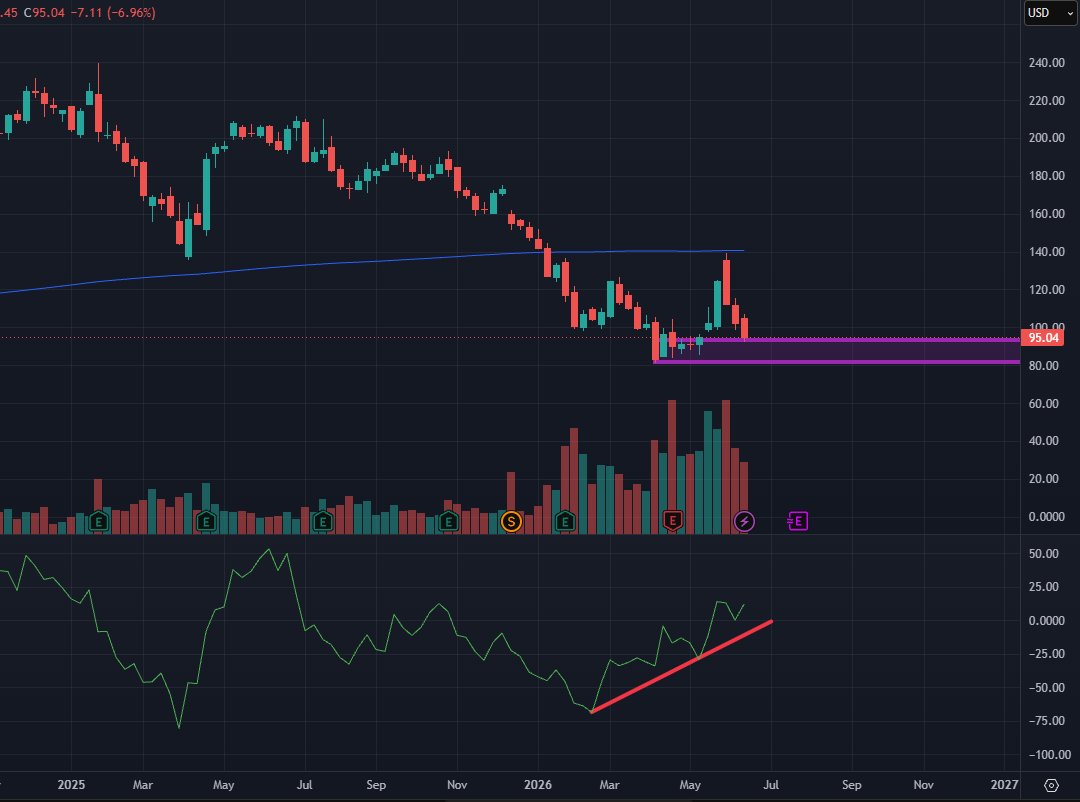
NOW is at a low on the weekly chart, but momentum is in an uptrend; watch for higher low confirmation.
Zachary Markovich
TA_Analyst
Trader
B
23.6K @Zac_Markovich Chart Request: $NOW
Weekly trading back down at lows.
Momentum still in an uptrend. Watch for higher low confirmation. https://t.co/rDJvdZ1jgY
 35
35
 6
6
 5.1K
5.1K
2026-06-21 23:57
Tendance de NOW après le lancement
Haussier
NOW is at a low on the weekly chart, but momentum is in an uptrend; watch for higher low confirmation.

MarketMaestro
TA_Analyst
FA_Analyst
C
46.4K @MarketMaestro1 Haussier
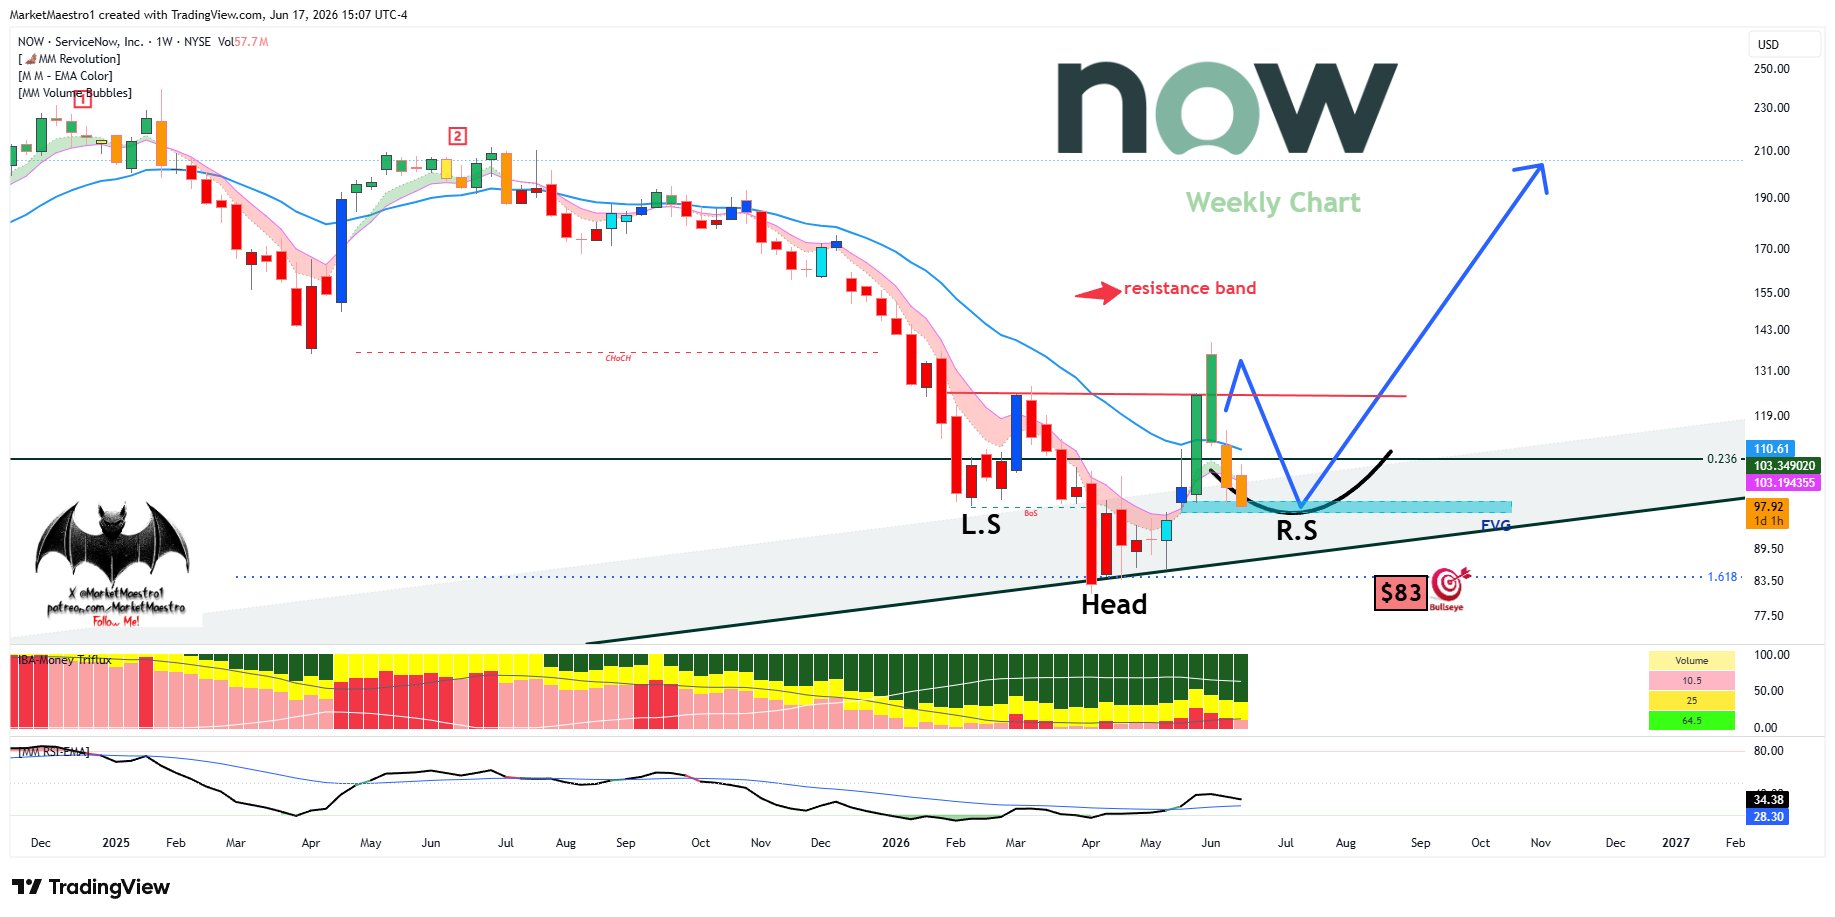
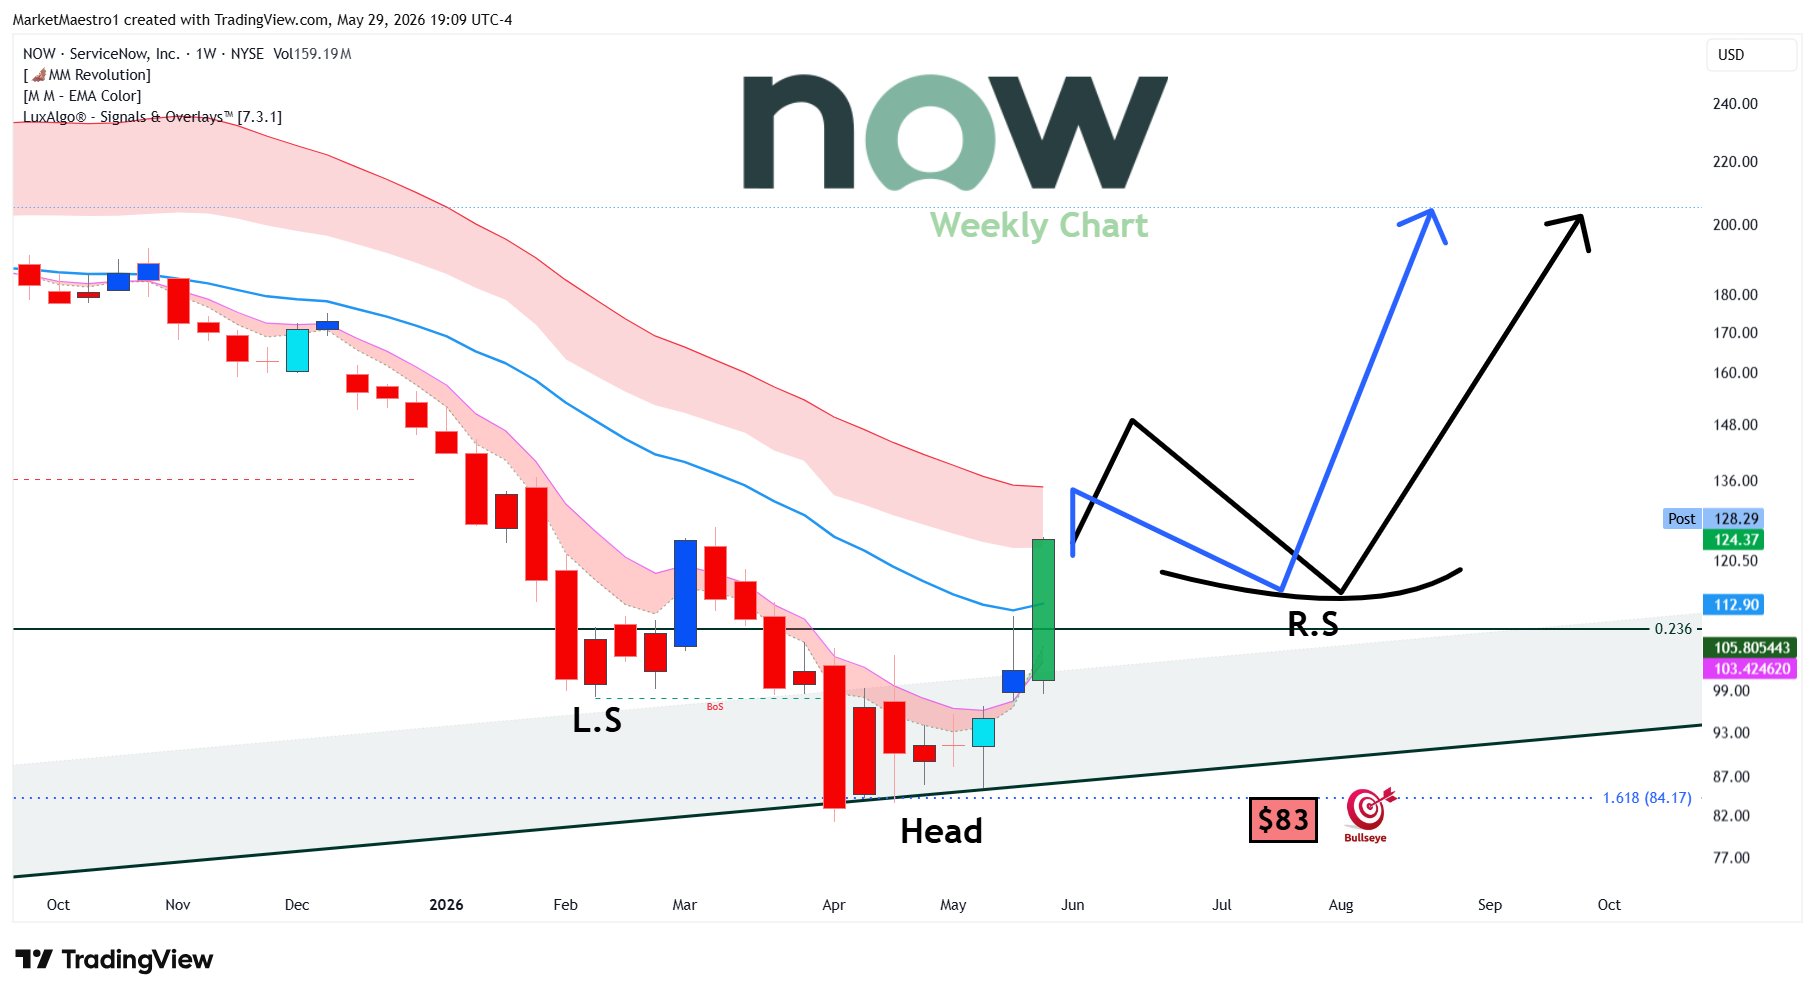
NOW may form an inverse head-and-shoulders bottom, with a potential steep rise after a short-term pullback.
$NOW
I am watching it this way https://t.co/h6MkzlJc2w
MarketMaestro
TA_Analyst
FA_Analyst
C
46.4K @MarketMaestro1 $NOW
I see both paths as possible. I think it will need a small right shoulder https://t.co/7CkKTBfyxb
 238
8
36.4K
238
8
36.4K
2026-06-17 19:17
Tendance de NOW après le lancement
Haussier
NOW may form an inverse head-and-shoulders bottom, with a potential steep rise after a short-term pullback.

Jake Wujastyk
TA_Analyst
Educator
C
397.3K @Jake__Wujastyk Extrêmement haussier
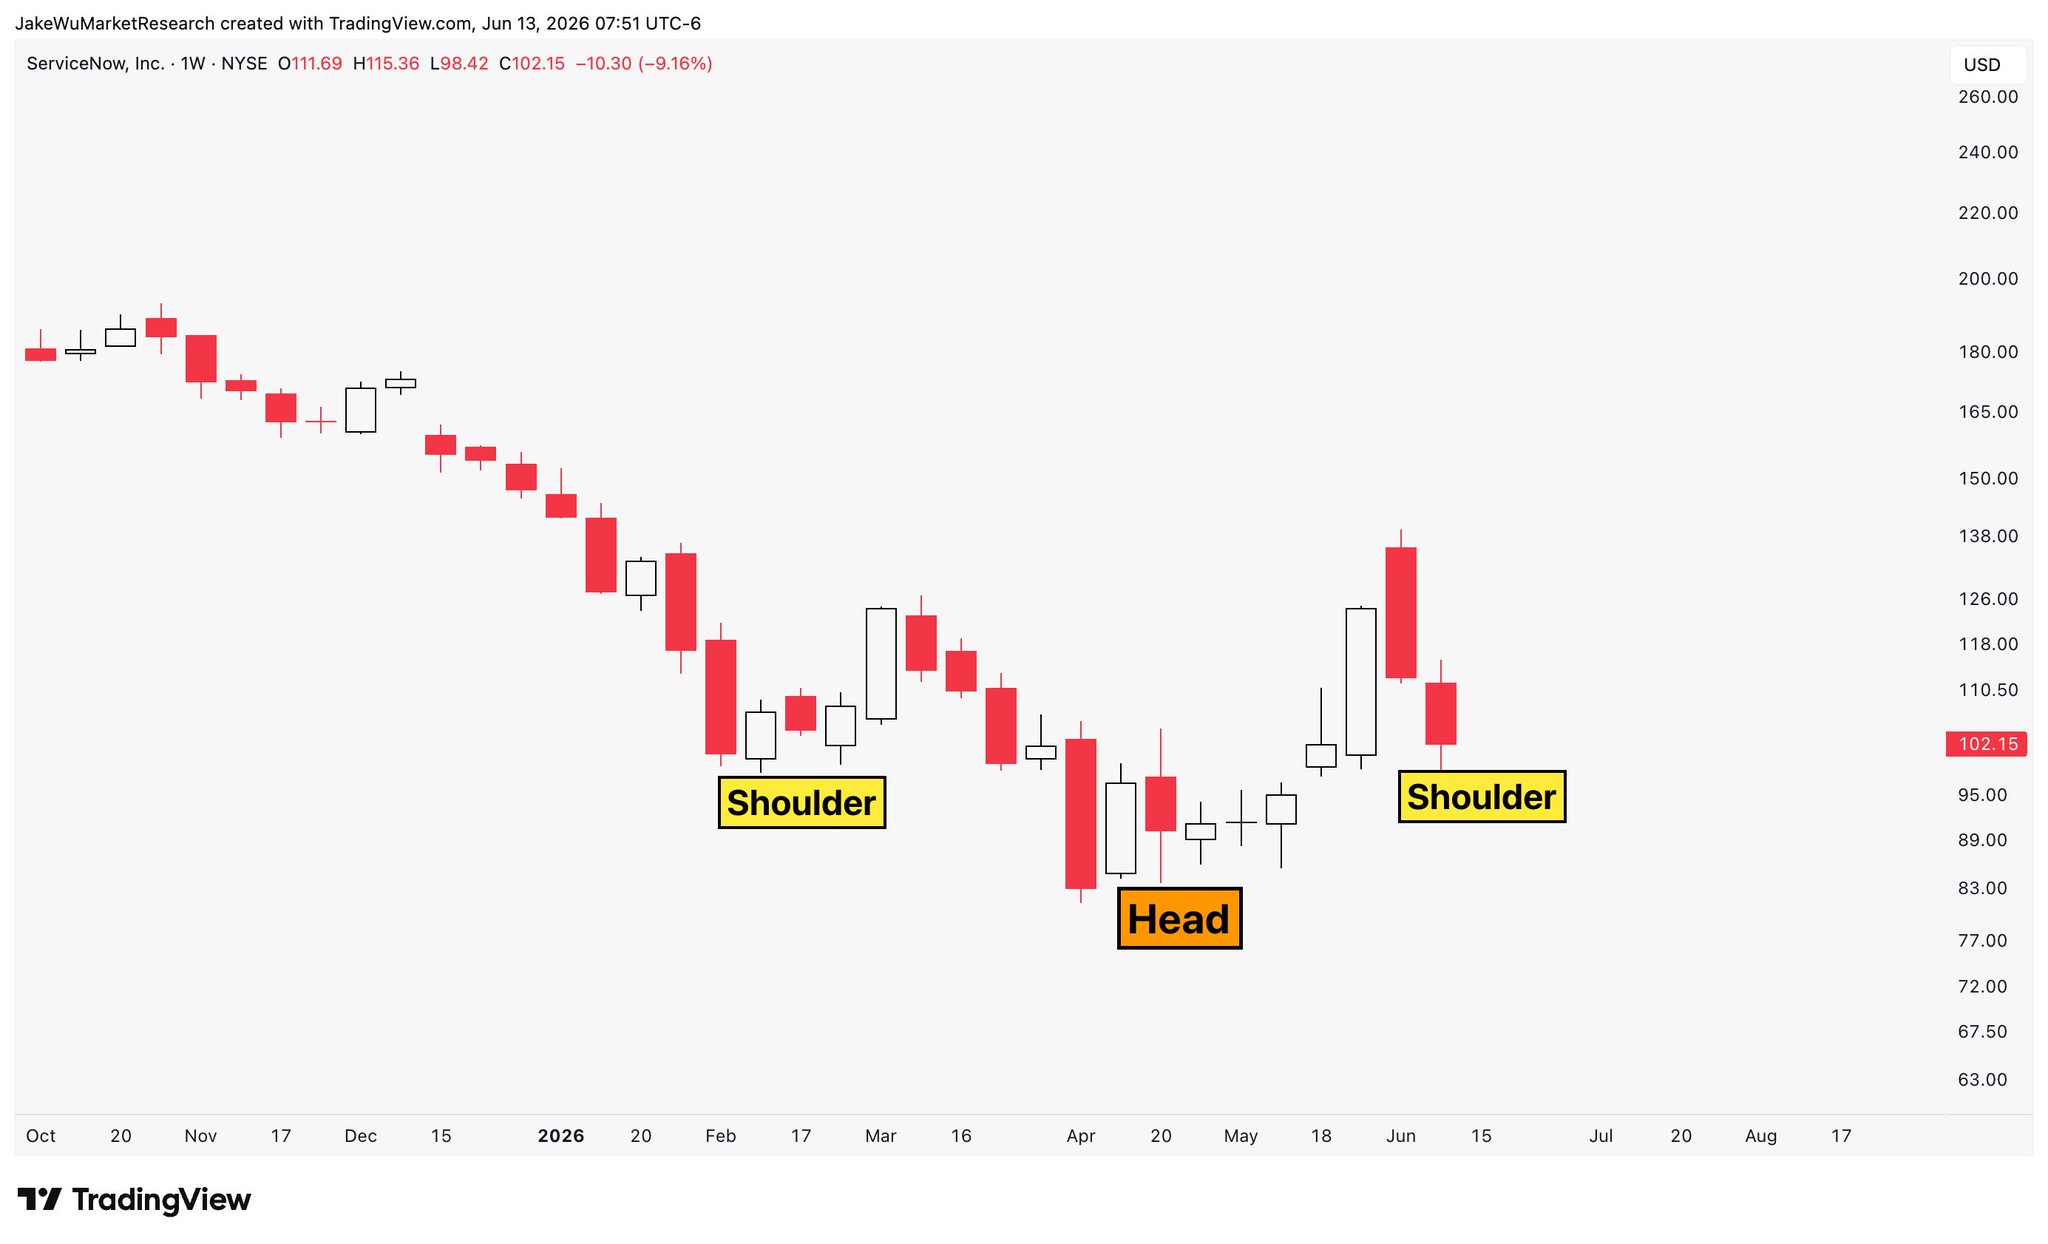
NOW asset, due to Trump's holding and head‑shoulder bottom pattern, is expected to rise.
Jake Wujastyk
TA_Analyst
Educator
C
397.3K @Jake__Wujastyk $NOW #NOW With this being in Trump's portfolio, I don't see it being down here again for much longer. https://t.co/NK7G47IE0G
 487
26
59.8K
487
26
59.8K
2026-06-13 18:57
Tendance de NOW après le lancement
Extrêmement haussier
NOW asset, due to Trump's holding and head‑shoulder bottom pattern, is expected to rise.
Prévision de prix
Quel est le meilleur moment pour acheter NOW? Dois-je acheter ou vendre NOW maintenant ?
Pour déterminer s'il est opportun d'acheter ou de vendre ServiceNow Inc (Derivatives) (NOW), il est important de commencer par s'aligner sur sa propre stratégie de trading et son profil de risque. Les investisseurs à long terme et les traders à court terme interprètent souvent les conditions du marché différemment, votre décision doit donc refléter votre approche personnelle. Selon la dernière analyse technique NOW de 4 heures, le signal de trading actuel est Tenez.

Prédiction de Beacon
Prévision probabiliste des prix (Prochaines 24 heures)Avertissement de prédiction de Beacon
Les résultats affichés sur cette page sont analysés sur la base des données de trading réelles (OHLCV) de la paire de trading sélectionnée ainsi que des indicateurs techniques correspondants.
Cette prédiction est un produit technique expérimental et est fournie uniquement à titre de référence. Ceci ne constitue pas un conseil en investissement. Des événements inattendus du monde réel peuvent avoir un impact significatif sur le comportement du marché. Les traders doivent prendre des décisions avec prudence.
Cette prédiction est un produit technique expérimental et est fournie uniquement à titre de référence. Ceci ne constitue pas un conseil en investissement. Des événements inattendus du monde réel peuvent avoir un impact significatif sur le comportement du marché. Les traders doivent prendre des décisions avec prudence.
À propos ServiceNow Inc (Derivatives)
ServiceNow Inc (Derivatives) (NOW) is a cryptocurrency . ServiceNow Inc (Derivatives) has a current supply of 0. The last known price of ServiceNow Inc (Derivatives) is 93.92181166 USD and is down -2.24 over the last 24 hours. It is currently trading on 32 active market(s) with $0.00 traded over the last 24 hours.
En savoir plus
En savoir plus
BM Discovery


Nouvelle annonce

SOXLON Direxion Daily Semi Bull 3X ETF
-- 0.00%

NIOON NIO
-- 0.00%

HYGON iBoxx $ High Yield Corporate Bond ETF
-- 0.00%

AURON Aurora Innovation
-- 0.00%

IGVON iShares Expanded Tech-Software ETF
-- 0.00%

SQQQON ProShares UltraPro Short QQQ
-- 0.00%

IBITON iShares Bitcoin Trust ETF
-- 0.00%

AMCON AMC Entertainment Holdings
-- 0.00%

GRABON Grab Holdings
-- 0.00%

SNAPON Snap(Ondo)
-- 0.00%