

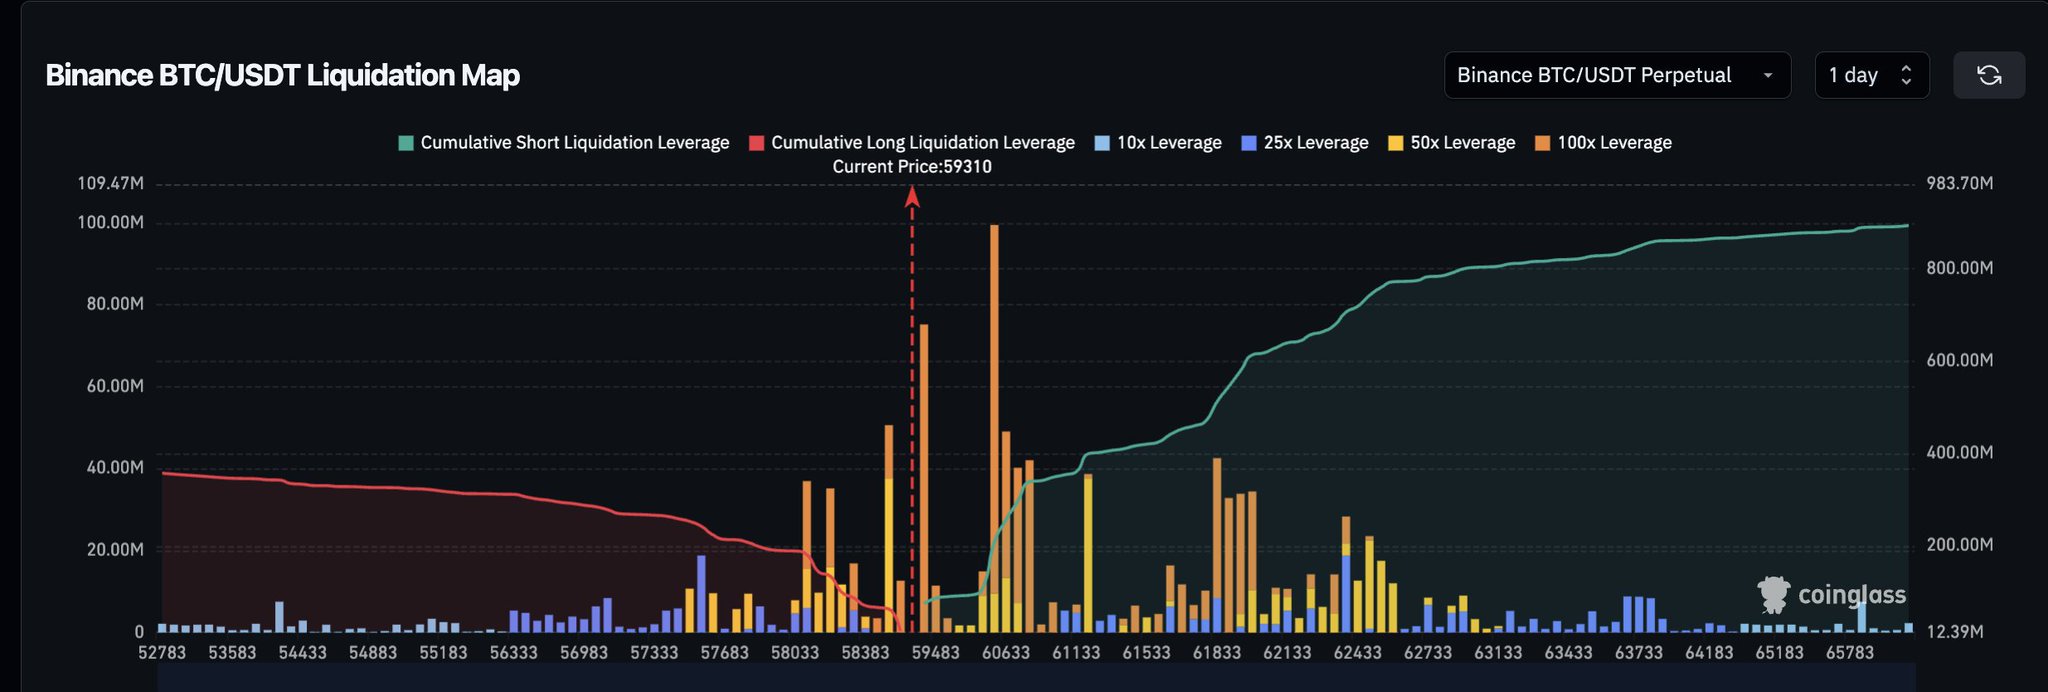
Binance Liquidation Map
Note: Not gonna lie this is looking better. Longs have been somewhat capitulated. https://t.co/3eaV4gslr8


 243.5K @martypartymusic
 Binance Liquidation Map
Note: Not gonna lie this is looking better. Longs have been somewhat capitulated. https://t.co/3eaV4gslr8
 0
0
 0
0
 987
987
 152.9K @SimplyBitcoin
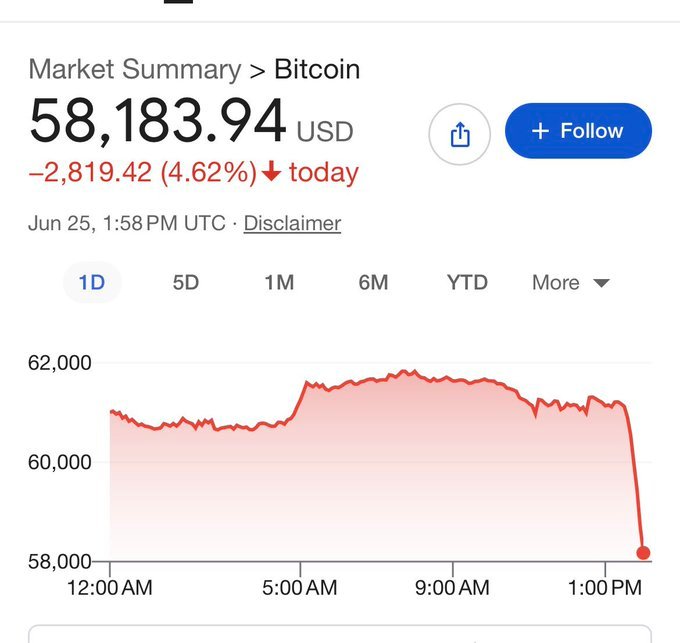
 Wild.
Bitcoin is at $58,000.
We are so back 🤝 https://t.co/6SzRqnaw0J
 0
0
659
0
0
659
 95.2K @seth_fin
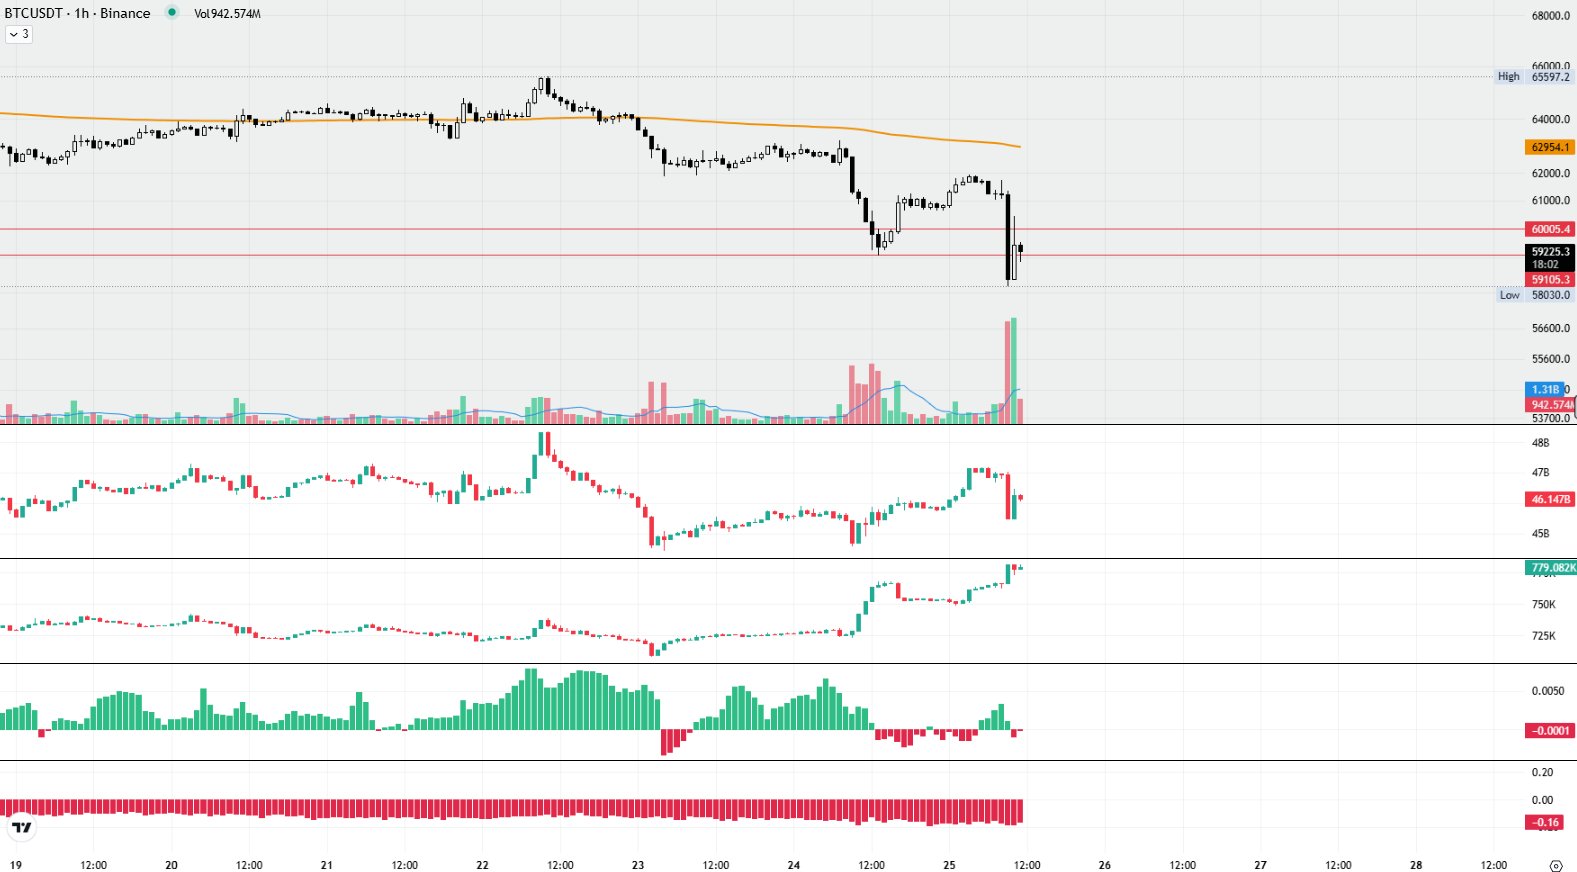
 Leverage shorts are still dominating
Funding is negative again
$BTC wicked down below 59,000 with huge volume flushing the longs that opened yesterday
The retail traders are sitting by their phone and waiting to long the bottom with 100x every chance they get and get wiped https://t.co/Tkb7njQKpO
 7
1
1.9K
7
1
1.9K


