

Woke up to my neighbor’s rooster at 5:12 AM, immediately checked charts on my cracked Android while chain-smoking on the porch steps.
My “retirement plan” is just more sats and prayer.
Family thinks I’m gambling again.
Bitcoin’s turning this broke-ass bloodline around while they still argue over who gets grandma’s broken riding mower.
Mua tiền điện tử
thẻ
Giao dịch P2P
Mua USDT trên thị trường
Thẻ Credit/Debit
Mua tiền mã hóa bằng thẻ Visa hoặc MasterCard
Dịch vụ thanh toán của bên thứ ba
Mua tiền mã hóa qua MoonPay, Simplex và nhiều dịch vụ khác
BitMart Card
Giúp bạn sống theo phong cách tiền mã hóa
Thẻ trả trước tiền mã hóa
Nhận thẻ Mastercard có thể sử dụng ngay
USDⓈ-M
Sử dụng USDⓈ làm tài sản đảm bảo
COIN-M
Sử dụng chính COIN làm tài sản đảm bảo
TradFi
Dịch vụ giao dịch trọn gói cho kim loại, cổ phiếu và ngoại hối
Giao dịch demo
Tìm hiểu cách giao dịch không gặp rủi ro
Tổng quan về Futures
Nền tảng toàn diện cho Futures
Futures King
Quỹ thưởng 478,000 USDT
Tăng trưởng
Rewards
Rút thăm Futures hàng ngày
100% cơ hội chiến thắng với giao dịch hàng ngày
Rút thăm Spot hàng ngày
Nhận các giải thưởng lớn trị giá 8,888 USDT
Nạp tiền điện thoại
Nạp tiền điện thoại di động dễ dàng, online, bảo mật
Send
Send money globally, fast and secure
BitMart Mall
Trực tiếp trên tiền mã hóa
Bullish Trump Coin BTC Lịch sử giá USD
Theo dõi giá của Bullish Trump Coin hôm nay, 7 ngày, 30 ngày và 90 ngày
Kỳ
Thay đổi
Biến động (%)
Hôm nay
$ 271.51
-0.42%
7ngày
$ 1,754.14
-2.67%
30ngày
$ 13,597.09
-17.54%
90ngày
$ 3,862.36
-5.70%
Sở hữu BTC ngay
Mua và bán BTC dễ dàng và an toàn trên BitMart.
Bullish Trump Coin Thông tin thị trường
$ 63,215.84 Biến động 24 giờ $ 64,513.95
Cao nhất từng ghi nhận
$ 126,065.76
Thấp nhất từng ghi nhận
$ 631.33
Biến động 24 giờ
-0.31%
Khối lượng 24 giờ
$ 126,973,430.31
Nguồn cung lưu hành
20.04M
BTC
Vốn hóa thị trường
$ 1.28T
Nguồn cung tối đa
21.00M
BTC
Vốn hóa thị trường đã pha loãng hoàn toàn
$ 1.34T
Giao dịch BTC
Bullish Trump Coin X Insight

Adam Livingston
FA_Analyst
Influencer
A
 82.9K @AdamBLiv
 Tăng giá
Bitcoin helps families turn things around, outlook looks positive
 0
0
 0
0
 143
143
2026-06-22 00:33
Xu hướng của BTC sau khi phát hành
Tăng giá
Bitcoin helps families turn things around, outlook looks positive

The Bitcoin Historian
Media
Influencer
C
214.8K @pete_rizzo_ Cực kỳ lạc quan
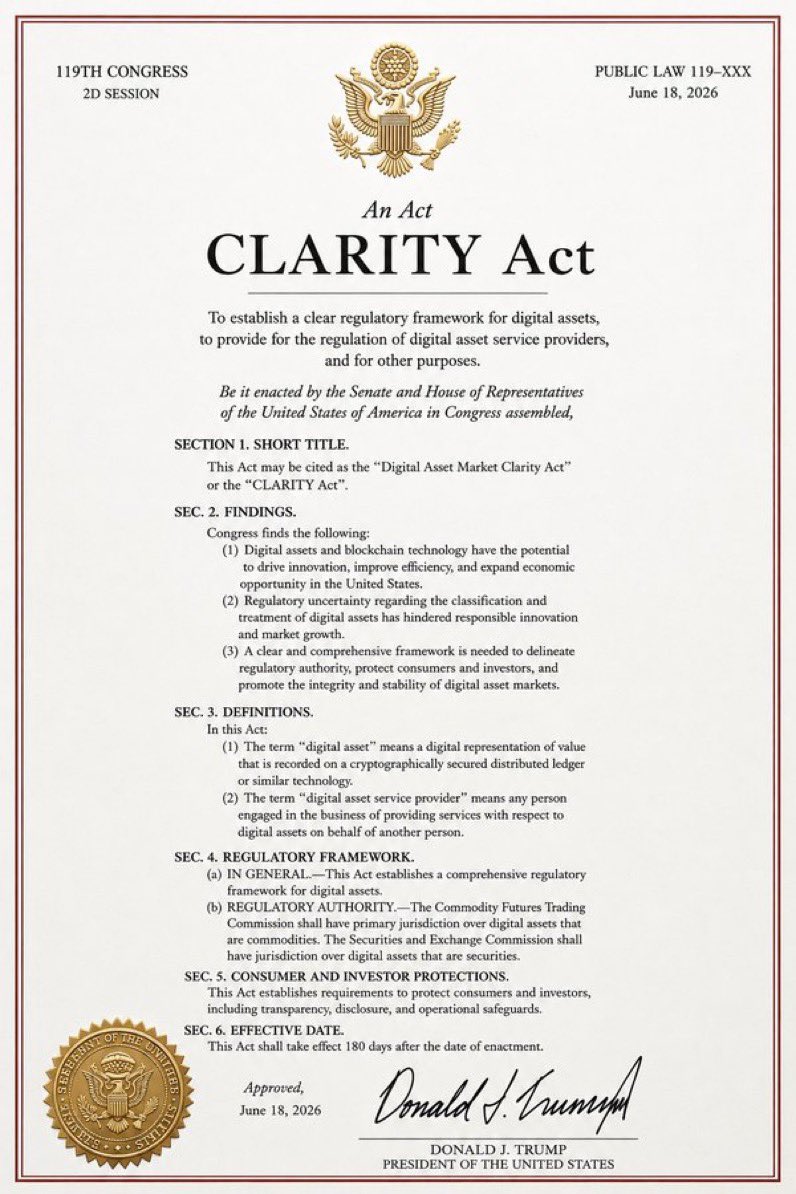
The US Senate will finalize the Crypto Clarity Act, bringing regulatory clarity to the digital asset market.
The Bitcoin Historian
Media
Influencer
C
214.8K @pete_rizzo_ LATEST: US SENATE WILL MEET TO FINALIZE THE #BITCOIN AND CRYPTO CLARITY ACT THIS WEEK
LIKE, IF YOU WANT TRUMP TO SIGN THIS BILL IMMEDIATELY 🔥 https://t.co/tLioaF8GIW
 35
2
2.6K
35
2
2.6K
2026-06-22 00:32
Xu hướng của BTC sau khi phát hành
Cực kỳ lạc quan
The US Senate will finalize the Crypto Clarity Act, bringing regulatory clarity to the digital asset market.

吴说区块链
Media
Educator
D
177.6K @wublockchain12 Cực kỳ bi quan
A large amount of short positions indicate a pessimistic outlook on BTC, SOL, and ETH.
According to monitoring by Onchain Lens, the newly created wallet 0xaea deposited 6.68 million USDC into Hyperliquid and opened short positions with 20× leverage, including 430.64 BTC (approximately $27 million), 181,245 SOL (approximately $13 million) and 4,280 ETH (approximately $7 million).
https://t.co/J6xgKkXdXQ
0
0
359
2026-06-22 00:32
Xu hướng của BTC sau khi phát hành
Giảm giá
A large amount of short positions indicate a pessimistic outlook on BTC, SOL, and ETH.
Dự đoán giá
Thời điểm phù hợp để mua BTC là khi nào? Liệu tôi nên mua hay bán BTC bây giờ?
Khi quyết định xem đây có phải là thời điểm tốt để mua hoặc bán Bullish Trump Coin (BTC) hay không, điều quan trọng trước tiên là phải phù hợp với chiến lược giao dịch và mức độ chấp nhận rủi ro của riêng bạn. Các nhà đầu tư dài hạn và các nhà giao dịch ngắn hạn thường diễn giải điều kiện thị trường theo các cách khác nhau, vì vậy quyết định của bạn nên phản ánh cách tiếp cận cá nhân. Theo phân tích kỹ thuật 1 ngày mới nhất của BTC, tín hiệu hiện tại là Hold.

Dự đoán Beacon
Dự báo giá xác suất cho (24 giờ tới)Tuyên bố miễn trừ trách nhiệm về dự đoán Beacon
Kết quả dữ liệu hiển thị trên trang này được phân tích dựa trên dữ liệu giao dịch thực tế (OHLCV) của cặp giao dịch đã chọn cùng với các chỉ báo kỹ thuật tương ứng.
Dự đoán này là một sản phẩm kỹ thuật thử nghiệm và chỉ được cung cấp để tham khảo. Đây không phải là lời khuyên đầu tư. Những sự kiện bất ngờ trong thế giới thực có thể tác động đáng kể đến hành vi thị trường. Các nhà giao dịch nên đưa ra quyết định một cách thận trọng.
Dự đoán này là một sản phẩm kỹ thuật thử nghiệm và chỉ được cung cấp để tham khảo. Đây không phải là lời khuyên đầu tư. Những sự kiện bất ngờ trong thế giới thực có thể tác động đáng kể đến hành vi thị trường. Các nhà giao dịch nên đưa ra quyết định một cách thận trọng.
Hỏi đáp
How Many Bitcoins Are There?
How Much Is Bitcoin Today?
What Is Bitcoin Mining?
Giới thiệu Bullish Trump Coin
Bitcoin (BTC) là một tài sản kỹ thuật số và một hệ thống thanh toán được phát minh bởi Satoshi Nakamoto, người đã xuất bản một bài báo liên quan vào năm 2008 và phát hành dưới dạng phần mềm nguồn mở vào năm 2009. Hệ thống này có đặc điểm là ngang hàng; người dùng có thể giao dịch trực tiếp không qua trung gian. Các giao dịch được xác minh bởi các node mạng và được ghi lại trong sổ cái phân phối công khai được gọi là blockchain. Sổ cái sử dụng bitcoin làm đơn vị tài khoản. Hệ thống này hoạt động mà không có kho lưu trữ trung tâm hoặc quản trị viên duy nhất, điều này đã khiến Kho bạc Hoa Kỳ phân loại bitcoin là một loại tiền ảo phi tập trung. Bitcoin thường được gọi là tiền điện tử đầu tiên, mặc dù các hệ thống trước đó đã tồn tại. Bitcoin được mô tả chính xác hơn là loại tiền kỹ thuật số phi tập trung đầu tiên. Đây là loại hình lớn nhất xét về tổng giá trị thị trường tính đến thời điểm hiện tại.
Đọc thêm
Link chính thức
Mạng xã hội
Trình khám phá chuỗi


Mua BTC
Giao dịch BTC