Empezar
Escanee para descargar la aplicación
para iOS y Android

XDB CHAIN (XDB)

$
$ 0.00015 (XDB/USD)
14.29%
24H
24H1 semana1 min1YTodos
¿Qué le parece XDB hoy?
Alcista 0
Bajista 0
Alcista
Bajista
Alcista 0
Bajista 0
Nota: esta información es solo de referencia.

XDB CHAIN Datos de precios en tiempo real

El precio de hoy de XDB CHAIN es de $ 0.00015 (XDB/USD). Con una capitalización de mercado de $ 2.75M USD. Volumen de trading en 24 horas de $ 47,509.41 USD, Un cambio de precio en 24 horas de +14.29%. Y un suministro circulante de 17.20B XDB.

XDB CHAIN XDB Historial de precios USD

Siga el precio de XDB CHAIN para hoy, 7 días, 30 días y 90 días
Periodo
Cambiar
Cambio (%)
Hoy
0
14.29%
7días
--
--
30días
--
--
90días
0
-63.41%

Sea propietario de XDB ahora

Compra y vende XDB fácil y seguro en BitMart.
Comprar/Vender XDB ahora
Comprar/Vender {0} ahora
XDB CHAIN Información de mercado
Último precio $ 0.00015
$ 0.00013 Autonomía de 24 horas $ 0.00015
Máximo histórico
‎$ 0.00030‎
El mínimo histórico
‎$ 0.00013‎
Cambio en 24 h
‎14.29%‎
Volumen en 24 h
‎$ 47,509.41‎
Suministros en circulación
17.19B XDB
Market Cap
‎$ 2.75M‎
Suministro máximo
--
Capitalización de mercado totalmente diluida
‎$ 3.04M‎
Trade XDB

Ganar

Pon a trabajar tus criptomonedas inactivas y obtén ingresos pasivos a través de ahorros, staking y más.
Pruébelo ahora
Pruébelo ahora

XDB CHAIN X Insight

avatar
The post analyzes trading volume patterns, indicating that high volume at highs (like gold) signals a top and correction, while high volume at lows (like XDB) suggests whale accumulation, foreshadowing a reversal.

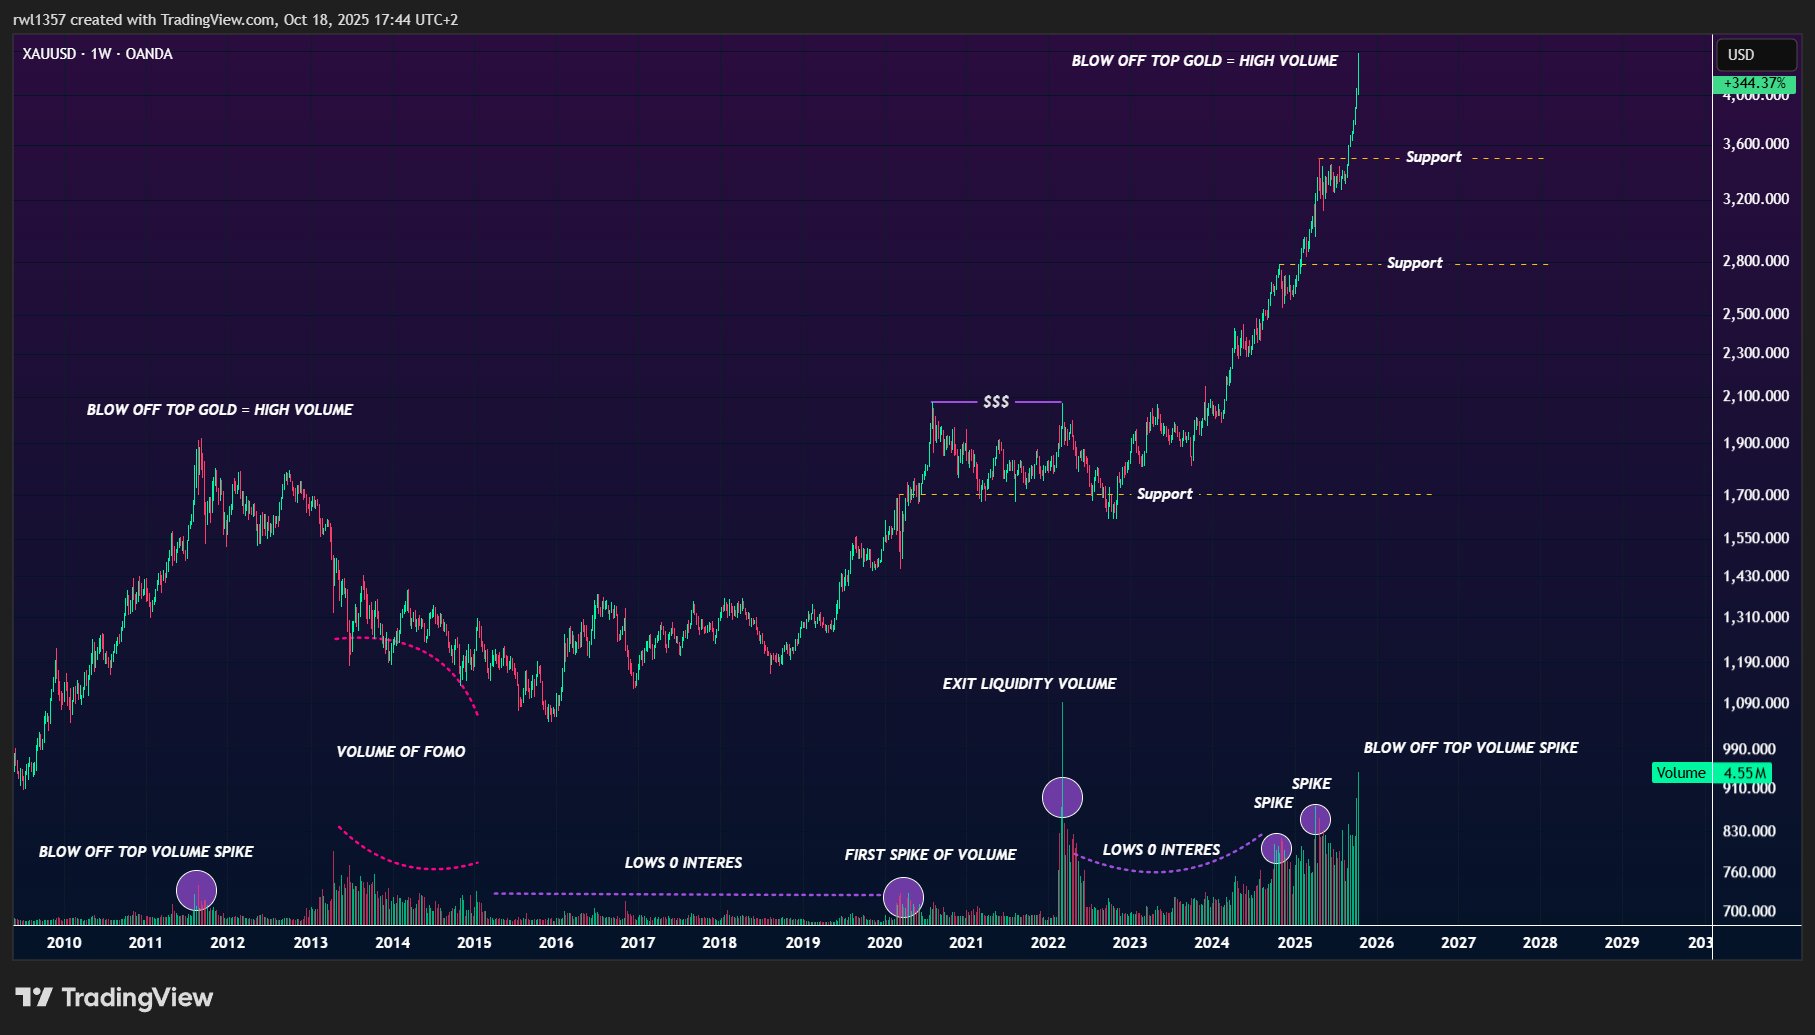
Basically, this post is explaining that everyone is currently buying and selling gold, creating huge trading volume as it is in a blow-off top phase. This phase usually comes right before a correction after a strong move to the upside, late buyers often end up getting punished.

Reading volume isn’t too complicated. When you see an asset with unusually high volume near its highs, it often signals the end of a run. For example, before Trump launched his meme coin, several others like Fartcoin, AI16z, Zerebro, GOAT + more pumped hard right after launch. But by the time most people heard about them, it was too late. The surge in volume came after the big move, meaning traders were buying the top.

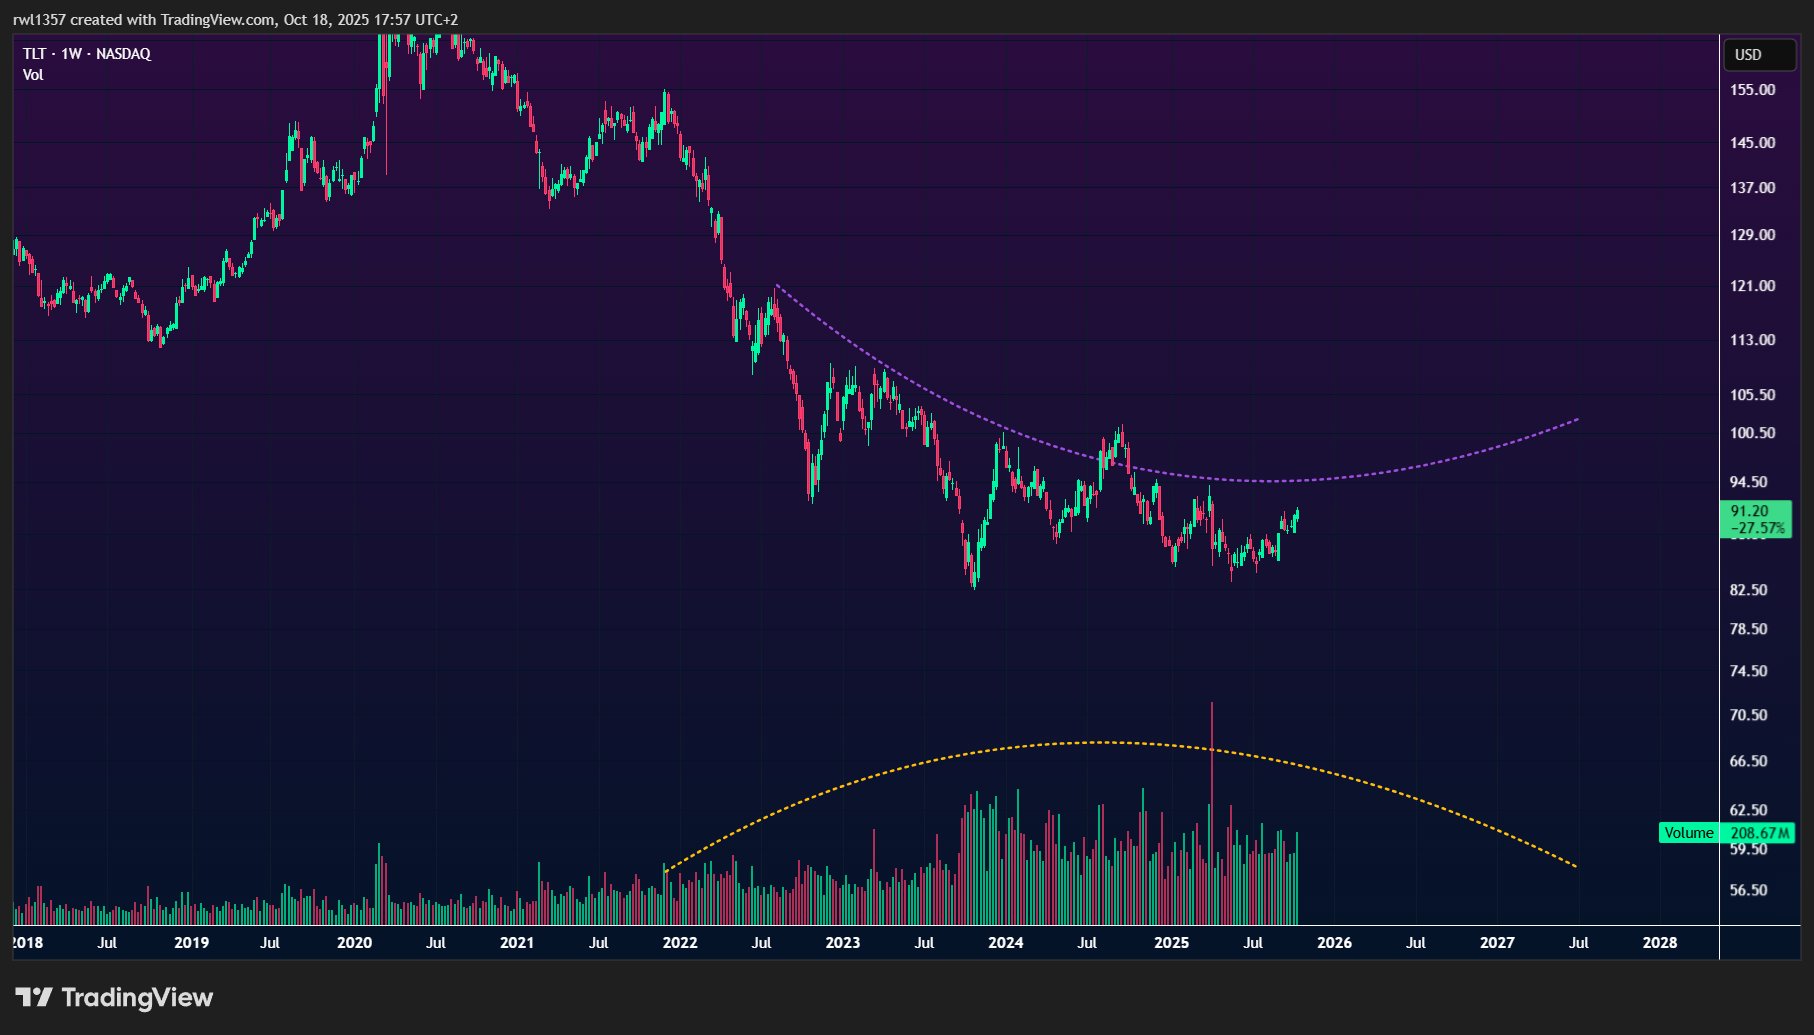
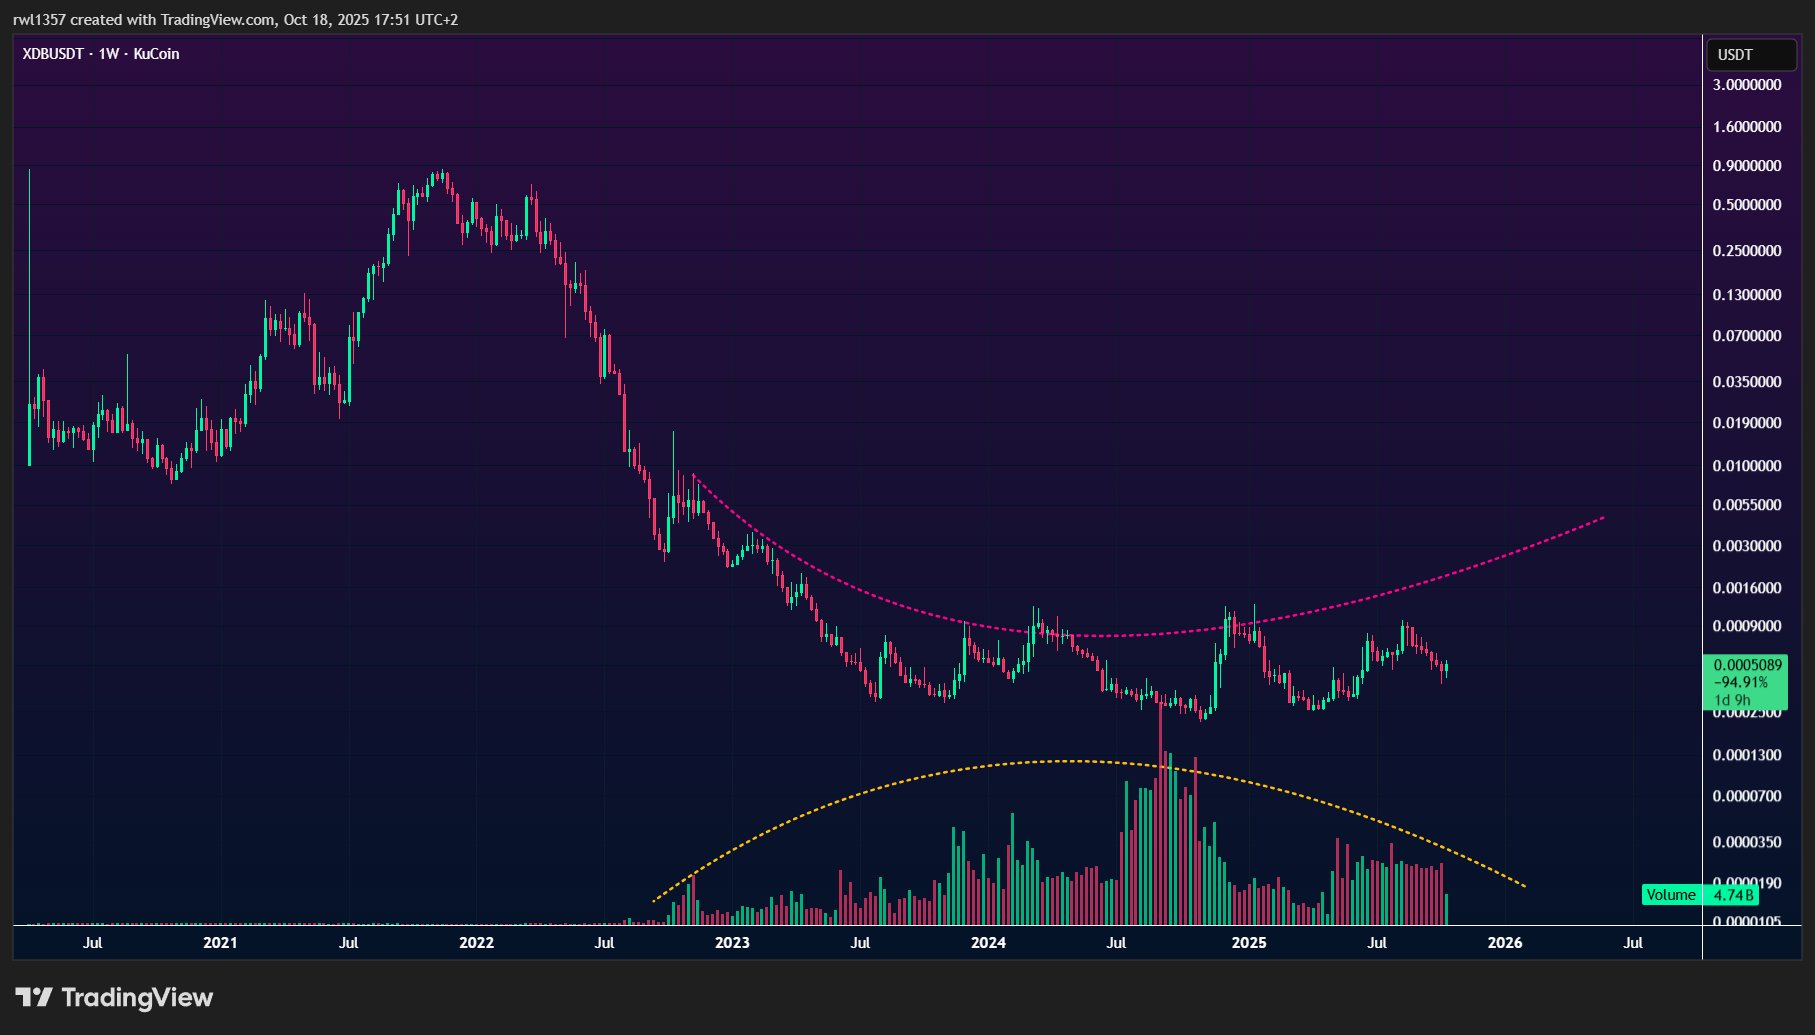
On the flip side, when you see high volume at market lows sometimes even higher than during all-time highs that often means whales are accumulating quietly, anticipating a reversal. This pattern shows up across the board, from ETFs like TLT to lesser-known altcoins like XDB. It’s a sign of bottom formation and silent accumulation before the crowd catches on.

So, in gold’s case, this move is a textbook example: high volume during a blow-off top means everyone’s piling in, pushing prices up but without realizing they’re likely getting trapped.

As a final note, volume can also help identify support and resistance levels.

avatar

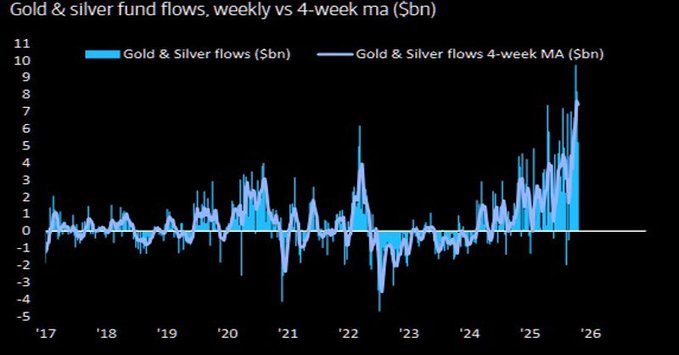
Gold - $34.2 billion of inflows in 10 weeks, biggest ever. Everyone’s long...

view 28
view 1
view 2.3K
115 días hace
Tendencia de XDB tras el lanzamiento
Sin datos
Bajista
The post analyzes trading volume patterns, indicating that high volume at highs (like gold) signals a top and correction, while high volume at lows (like XDB) suggests whale accumulation, foreshadowing a reversal.
Detalles

Predicción de precios

¿Cuándo es un buen momento para comprar XDB? ¿Debería comprar o vender XDB ahora?

Al decidir si es un buen momento para comprar o vender XDB CHAIN (XDB), es importante ajustarse primero a su propia estrategia de trading y perfil de riesgo. Los inversores a largo plazo y los traders a corto plazo suelen interpretar las condiciones del mercado de forma diferente, por lo que su decisión debe reflejar su enfoque personal. Según el último análisis técnico de 4 horas de XDB, la señal de trading actual es Vender. Según el último análisis técnico de 1 día de XDB, la señal actual es Hold.
28
Vender
Análisis técnico de 4 horas de XDB
Última actualización 2026-02-10 16:14:12
50
Hold
Análisis técnico de 1 día de XDB
Última actualización 2026-02-10 16:14:12
beacon

Predicción de Beacon

Pronóstico probabilístico de precios (próximas 24 horas)
crypto.loading
Sobre XDB CHAIN
XDB CHAIN (XDB) is a cryptocurrency launched in 2023. XDB CHAIN has a current supply of 18,974,370,019.97 with 17,197,670,082 in circulation. The last known price of XDB CHAIN is 0.00014632 USD and is down -3.68 over the last 24 hours. It is currently trading on 27 active market(s) with $160,366.71 traded over the last 24 hours. More information can be found at http://www.xdbchain.com.
Leer más