$AIN BITGET MM ACCUMULATION DETECTED
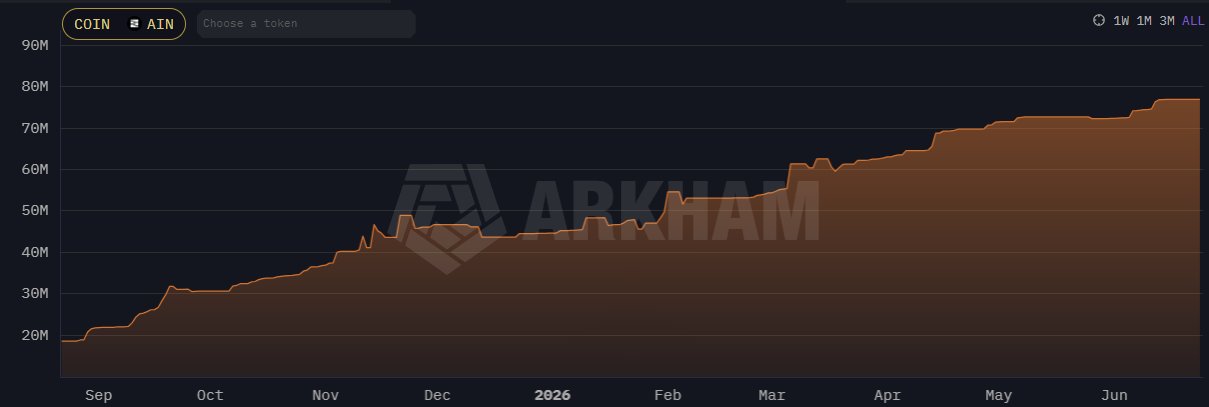
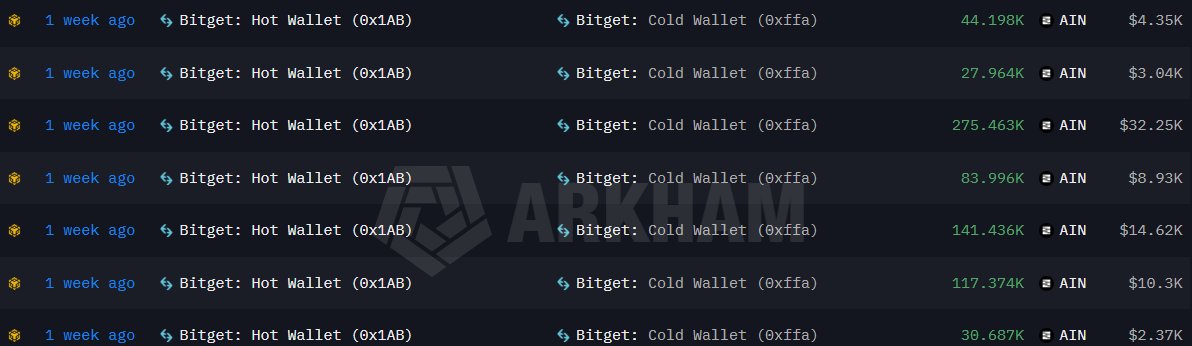
Bitget Cold Wallet has been quietly accumulating $AIN.
Total accumulated so far: 76.81M $AIN, worth around $5.32M.
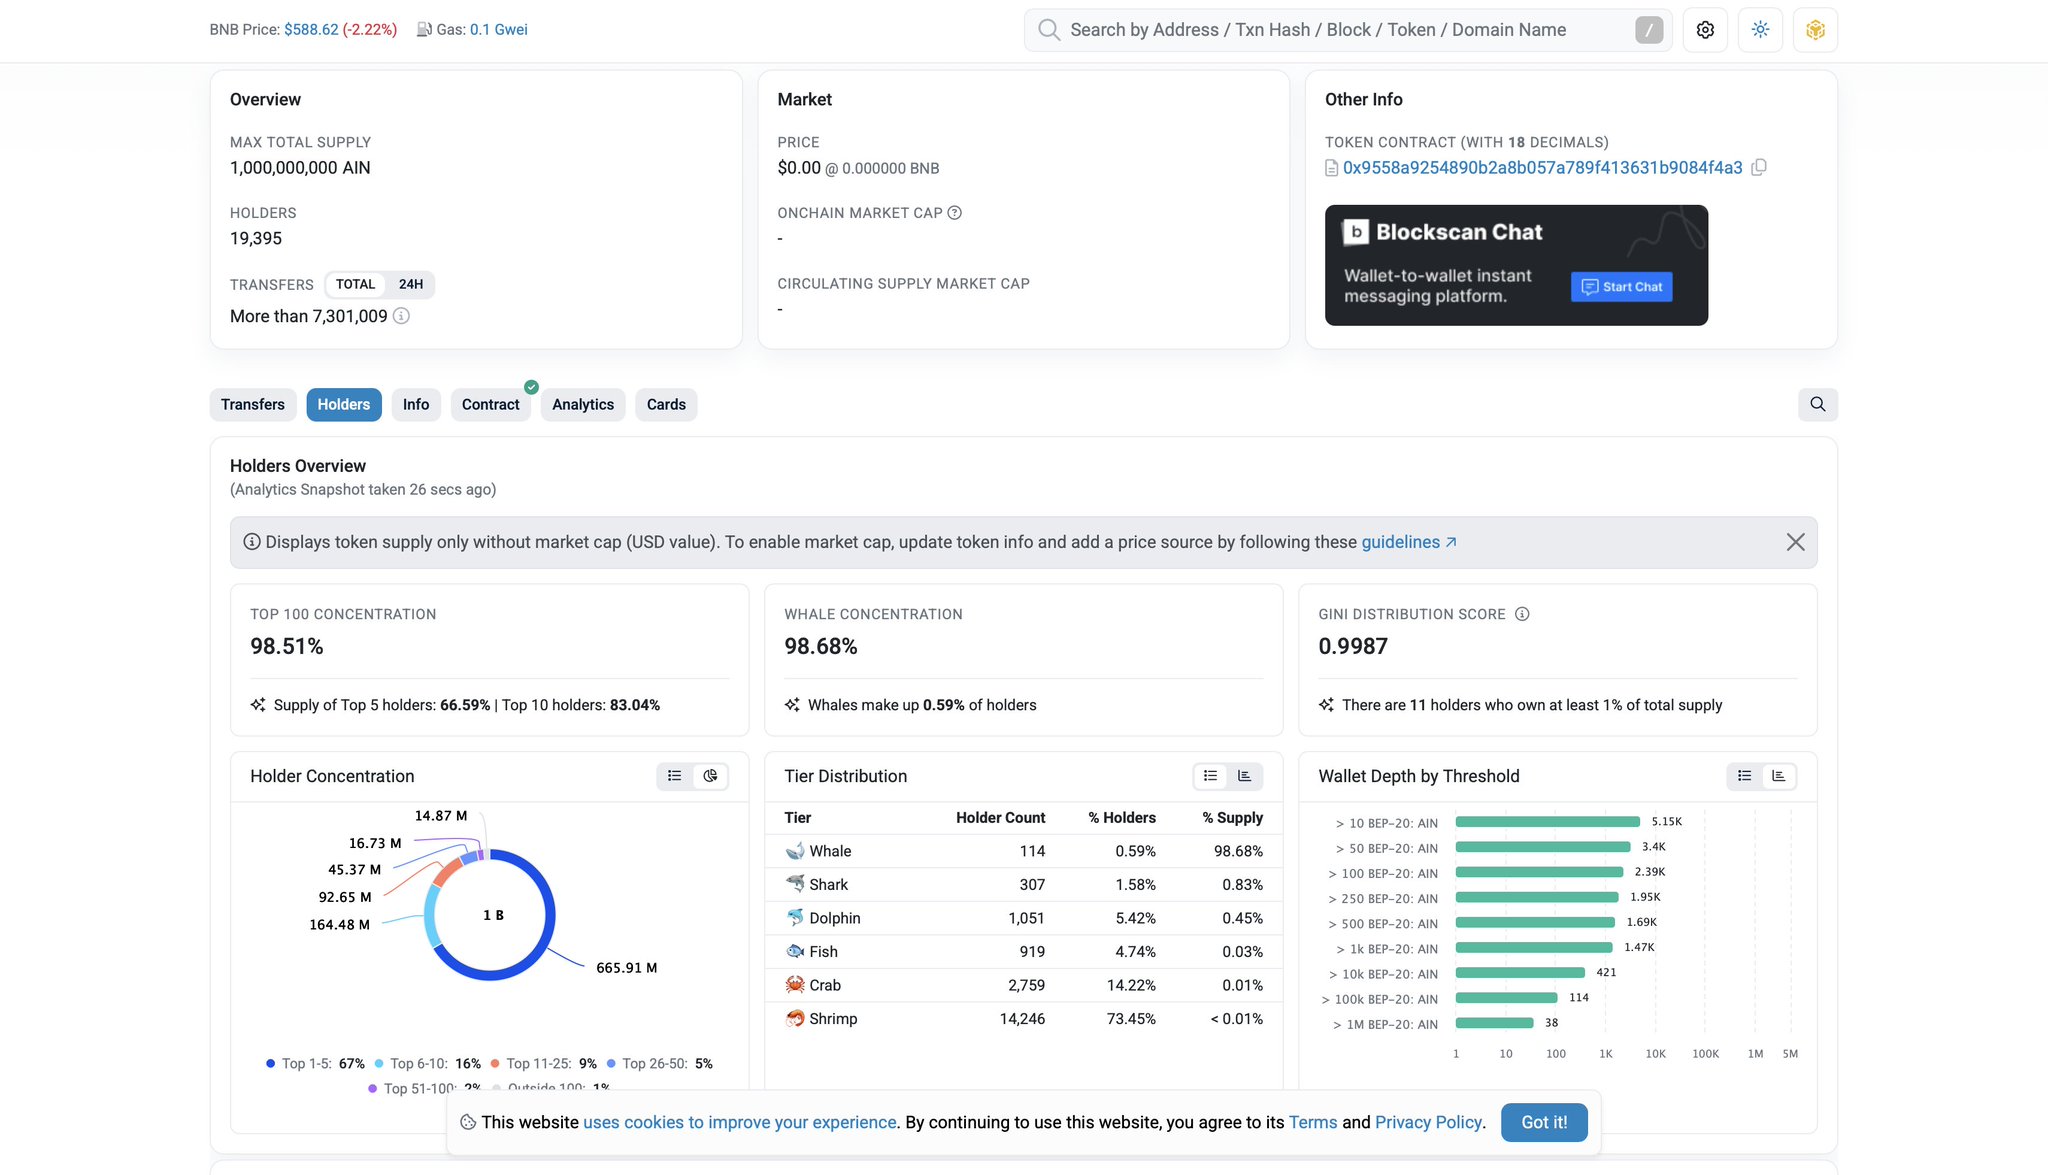
This equals roughly 25% of circulating supply.
Address: 0xffa8db7b38579e6a2d14f9b347a9ace4d044cd54
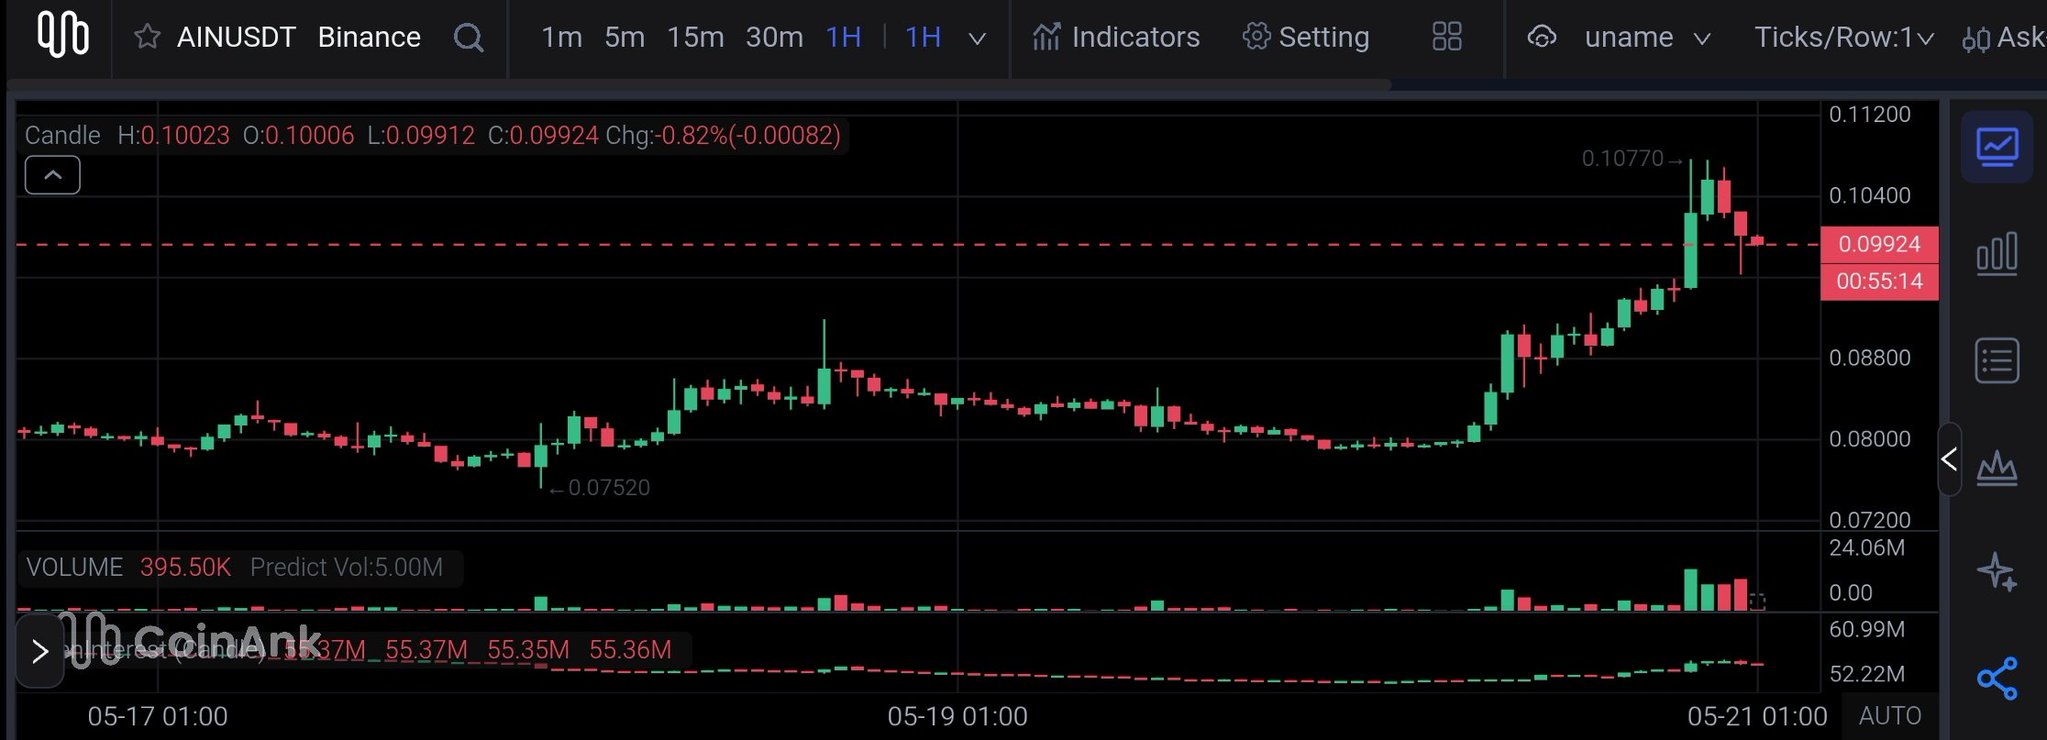
The chart also fits the same pattern we have seen across many strong Binance Alpha lowcaps this cycle:
Brutal max drawdowns that most retail holders can’t survive, shaking them out before the next expansion.
If Bitget MM supply control continues building, the AI narrative could become the next catalyst for $AIN.
Bitget accumulation + thin float + AI narrative.