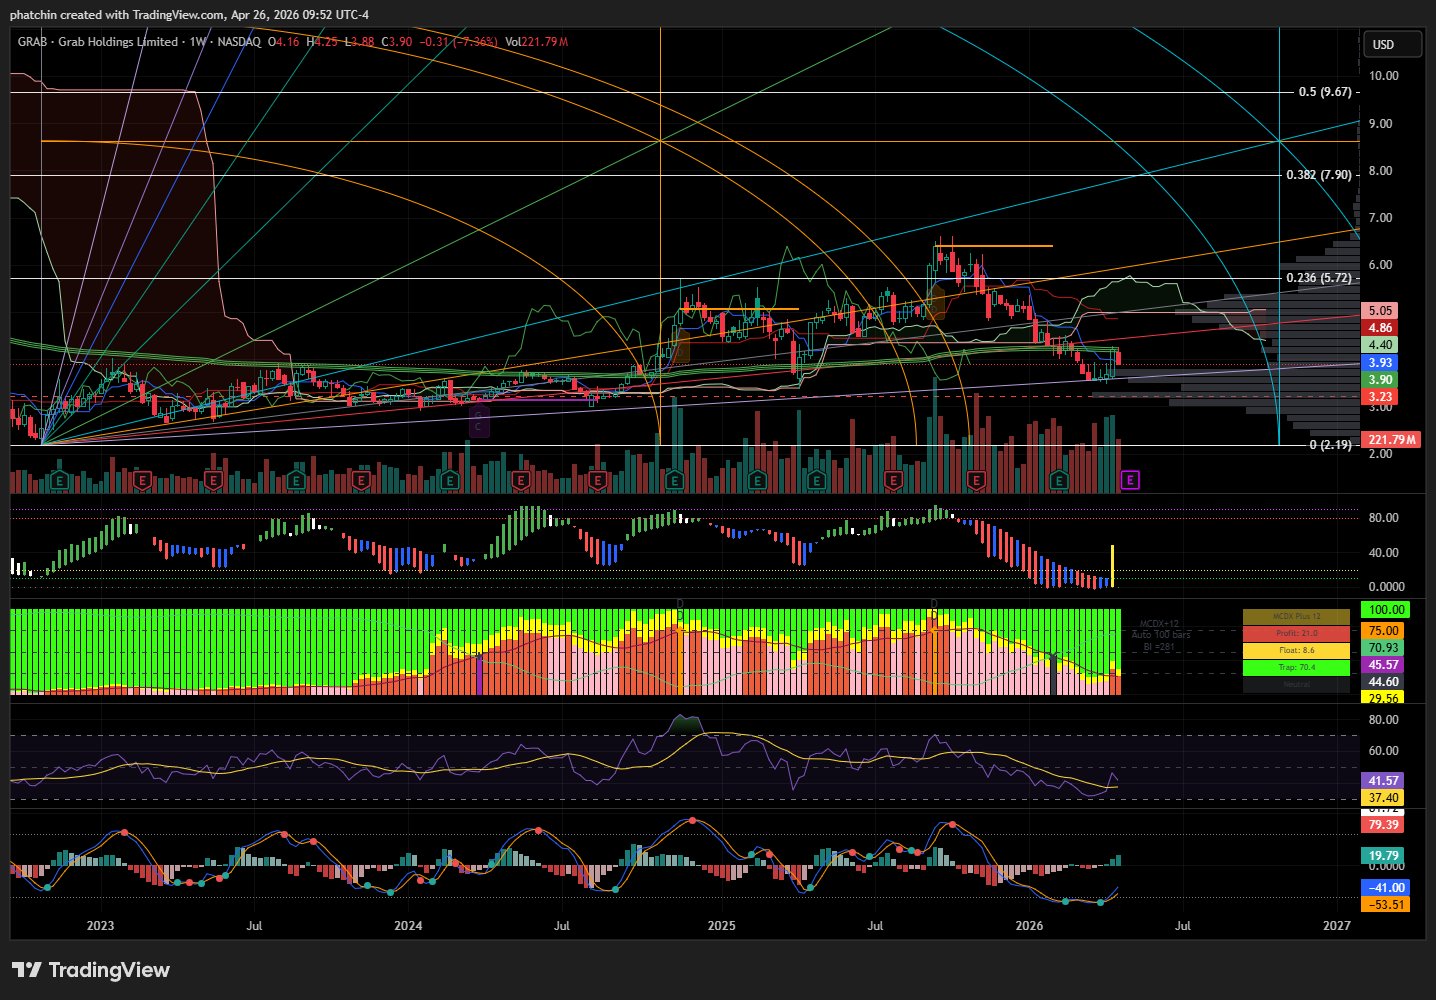
Fangen Sie an.
Zum Herunterladen scannen
iOS und Android
BitMart / Krypto / GRAB

GRABWAY (GRAB)

$
$ 0.0065 (GRAB/USD)
-25.87%
24H
24 Stunden1 Woche1 Min.1 JahrAlle
Wie fühlen Sie sich heute in Bezug auf GRAB?
Bullisch 0
Bärisch 0
Bullisch
Bärisch
Bullisch 0
Bärisch 0
Hinweis: Diese Informationen dienen nur zu Referenzzwecken.

GRABWAY GRAB Preisverlauf USD

Verfolgen Sie den Preis von GRABWAY für heute, 7 Tage, 30 Tage und 90 Tage
Zeitraum
Ändern
Veränderung (%)
Heute
0
-25.87%
7Tage
--
--
30Tage
--
--
90Tage
0
-87.50%

Besitzen Sie GRAB jetzt

Kaufen und verkaufen Sie GRAB einfach und sicher auf BitMart.
Jetzt GRAB kaufen/verkaufen
Jetzt {0} kaufen/verkaufen
GRABWAY Marktinformationen
Letzter Preis $ 0.0065
$ 0.0049 24-Std.-Bereich $ 0.0089
Allzeithoch
‎$ 0.18‎
Allzeittief
‎$ 0.0022‎
24-Std.-Veränderung
‎-25.87%‎
Menge 24 Std.
‎$ 1,564.41‎
Zirkulierendes Angebot
0.00 GRAB
Marktobergrenze
‎$ 0‎
Nettomenge
60.00M GRAB
Vollständig verwässerte Marktobergrenze
‎$ 395.13K‎
Handel GRAB

Verdienen

Setzen Sie Ihre ungenutzten Kryptowährungen ein und erzielen Sie passives Einkommen durch Ersparnisse, Staking und mehr.
Jetzt versuchen
Jetzt versuchen

GRABWAY X Insight

avatar
The author believes the Reddit community's fervent bullish sentiment about $GRAB has reached a 'mental illness' level.

TIL there is a subreddit for $GRAB and its just mental illness at this point https://t.co/glKGZoFSfe

view 0
view 0
view 819
20 Tage vor
Trend von GRAB nach Veröffentlichung
Keine Daten
Extrem bärisch
The author believes the Reddit community's fervent bullish sentiment about $GRAB has reached a 'mental illness' level.
avatar
GRAB is falling, looking for a bottom; the author is watching when it will bottom and rebound.

$GRAB where will the support base build at before it moves up? https://t.co/PgF6BOd4nB

view 0
view 0
view 248
24 Tage vor
Trend von GRAB nach Veröffentlichung
Keine Daten
Bullisch
GRAB is falling, looking for a bottom; the author is watching when it will bottom and rebound.
avatar
GRAB has broken below the 50‑week SMA and Fibonacci support, and may continue downward to $4.73 in the short term.
avatar

$GRAB weekly

Vicious selloff, yet on declining volume. Unfortunately, it broke below the 50-week SMA support and also the 0.382 log Fibonacci level.
Unless it manages to instantly reclaim the 0.382 next week, a move towards the upper bound of the Ichimoku cloud (currently at $4.73) seems likely (second chart).

view 19
view 0
view 5.2K
27 Tage vor
Trend von GRAB nach Veröffentlichung
Keine Daten
Extrem bärisch
GRAB has broken below the 50‑week SMA and Fibonacci support, and may continue downward to $4.73 in the short term.
Einzelheiten

Preisprognose

Wann ist ein guter Zeitpunkt, um GRAB zu kaufen? Soll ich GRAB jetzt kaufen oder verkaufen?

Bei der Entscheidung, ob es ein guter Zeitpunkt ist, GRABWAY (GRAB) zu kaufen oder zu verkaufen, ist es wichtig, sich zunächst an der eigenen Handelsstrategie und Ihrem Risikoprofil zu orientieren. Langfristig orientierte Anleger und kurzfristig orientierte Trader interpretieren Marktbedingungen oft unterschiedlich, daher sollte Ihre Entscheidung Ihre persönliche Herangehensweise widerspiegeln. Laut der neuesten vierstündigen technischen Analyse von GRAB lautet das aktuelle Handelssignal Halten. Laut der neuesten eintägigen technischen Analyse von GRAB lautet das aktuelle Signal Kaufen.
53
Halten
4-stündige technische Analyse von GRAB
Letzte Aktualisierung 2026-02-07 05:10:39
60
Kaufen
Eintägige technische Analyse von GRAB
Letzte Aktualisierung 2026-02-07 05:10:39
beacon

Beacon Vorhersage

Probabilistische Preisprognose (nächste 24 Stunden)
crypto.loading
Über GRABWAY
GRABWAY (GRAB) is a cryptocurrency launched in 2024and operates on the BNB Smart Chain (BEP20) platform. GRABWAY has a current supply of 60,000,000 with 0 in circulation. The last known price of GRABWAY is 0.01010167 USD and is down -4.56 over the last 24 hours. It is currently trading on 1 active market(s) with $71,882.23 traded over the last 24 hours. More information can be found at https://grabway.site/.
Mehr lesen