Rewards
Futures Daily Draw
100% Chance To Win With Daily Trades
現物の日次のドロー
Win 8,888 USDT In Grand Prizes
ステークして投票
投票してエアドロップを獲得
機関
プロなかつ専門的なサービス対応
BitMart VIP
限定報酬のロック解除
アカデミー
トレードとブロックチェーンについて
BitMart Internship
Start your Crypto Career Here
BitMart Travel
ワンストップグローバルトラベルサービス
モバイルチャージ
モバイルを簡単に、オンラインで、安全にチャージ
Send
Send money globally, fast and secure
BitMartモール
Live on crypto

Amp ライブ価格データ
Ampの今日の価格は$ 0.00052 (AMP/USD)です。 時価総額$ 45.24M USD、 24時間取引量$ 100.43K USD、 24時間の価格変動-0.19%、 そして流通供給量86.78B AMP。
Amp AMP 価格履歴 USD
Ampの今日、7日間、30日間、90日間の価格を追跡
期間
24H変動幅
24H変動率 (%)
本日
$ 0.0000029
-0.57%
7日
$ 0.0000039
-0.76%
30日
$ 0.00031
-37.49%
90日
$ 0.00066
-56.21%
AMPを今すぐ所有
BitMartでAMPを簡単に安全に売買できます。
Amp 相場情報
$ 0.00051 24H変動幅 $ 0.00052
過去最高値
$ 0.022
過去最安値
$ 0.00049
24H変動幅
-0.19%
24H取引高
$ 100,429.07
供給量
86.78B
AMP
時価総額
$ 45.24M
最大供給量
100.00B
AMP
完全希薄化後時価総額
$ 52.14M
取引 AMP

Amp Xインサイト

Jeremy Allaire - jerallaire.arc
Founder
Influencer
B
 181.0K @jerallaire
 強気
AMP is exploring transaction fairness and PFOF rebate functionality, still pending validation.

Gordon Liao D
9.5K @gordonliao AMP enables transaction fairness, PFOF rebates, and much more. Talk to us if you are interested in exploring serving as a proposer with App-Specific Sequencing and unique order flows.
Note: AMP is exploratory research at this stage until further validation.
 100
100
 10
10
 14.9K
14.9K
2026-06-12 08:27
リリース後のAMPのトレンド
強気
AMP is exploring transaction fairness and PFOF rebate functionality, still pending validation.

CJ Bennett
TA_Analyst
Educator
B
3.5K @the_real_CJ 中立
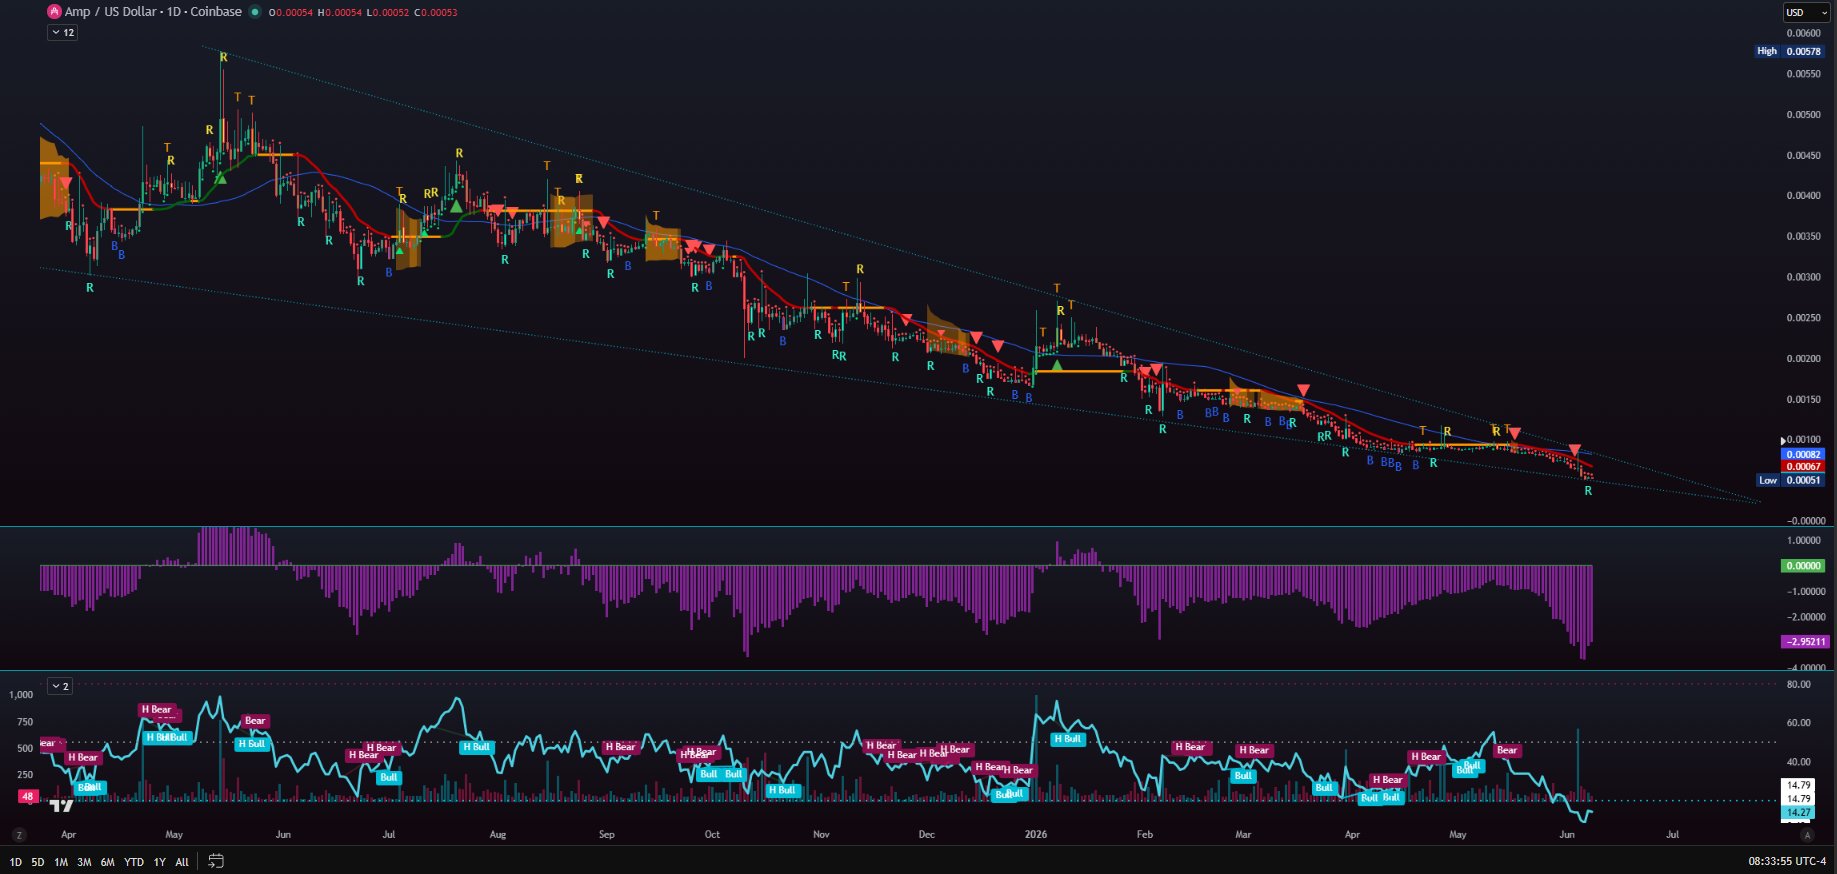
AMP has been in a long-term descending wedge pattern, with RSI severely oversold, and we need to watch whether it can break out and form a new trend before the end of July.
$amp
Still the same setup as the last few years: smaller structure inside a larger structure. The key areas to watch for above and below are still the same.
As time goes on, however, this smaller wedge will need to break inside the larger one. By the end of July, this smaller structure will have to break and create a new trend. The RSI has been horrendous and way oversold, but capitulation is what happens when you hit peak bear market levels. All in all, we just have to continue watching the above and below breaking points. This smaller wedge has been here since last January 2025.
 43
5
1.7K
43
5
1.7K
2026-06-08 12:57
リリース後のAMPのトレンド
中立
AMP has been in a long-term descending wedge pattern, with RSI severely oversold, and we need to watch whether it can break out and form a new trend before the end of July.

Crypto Tolga
TA_Analyst
Trader
B
79.1K @CryptoTolga_ 強気
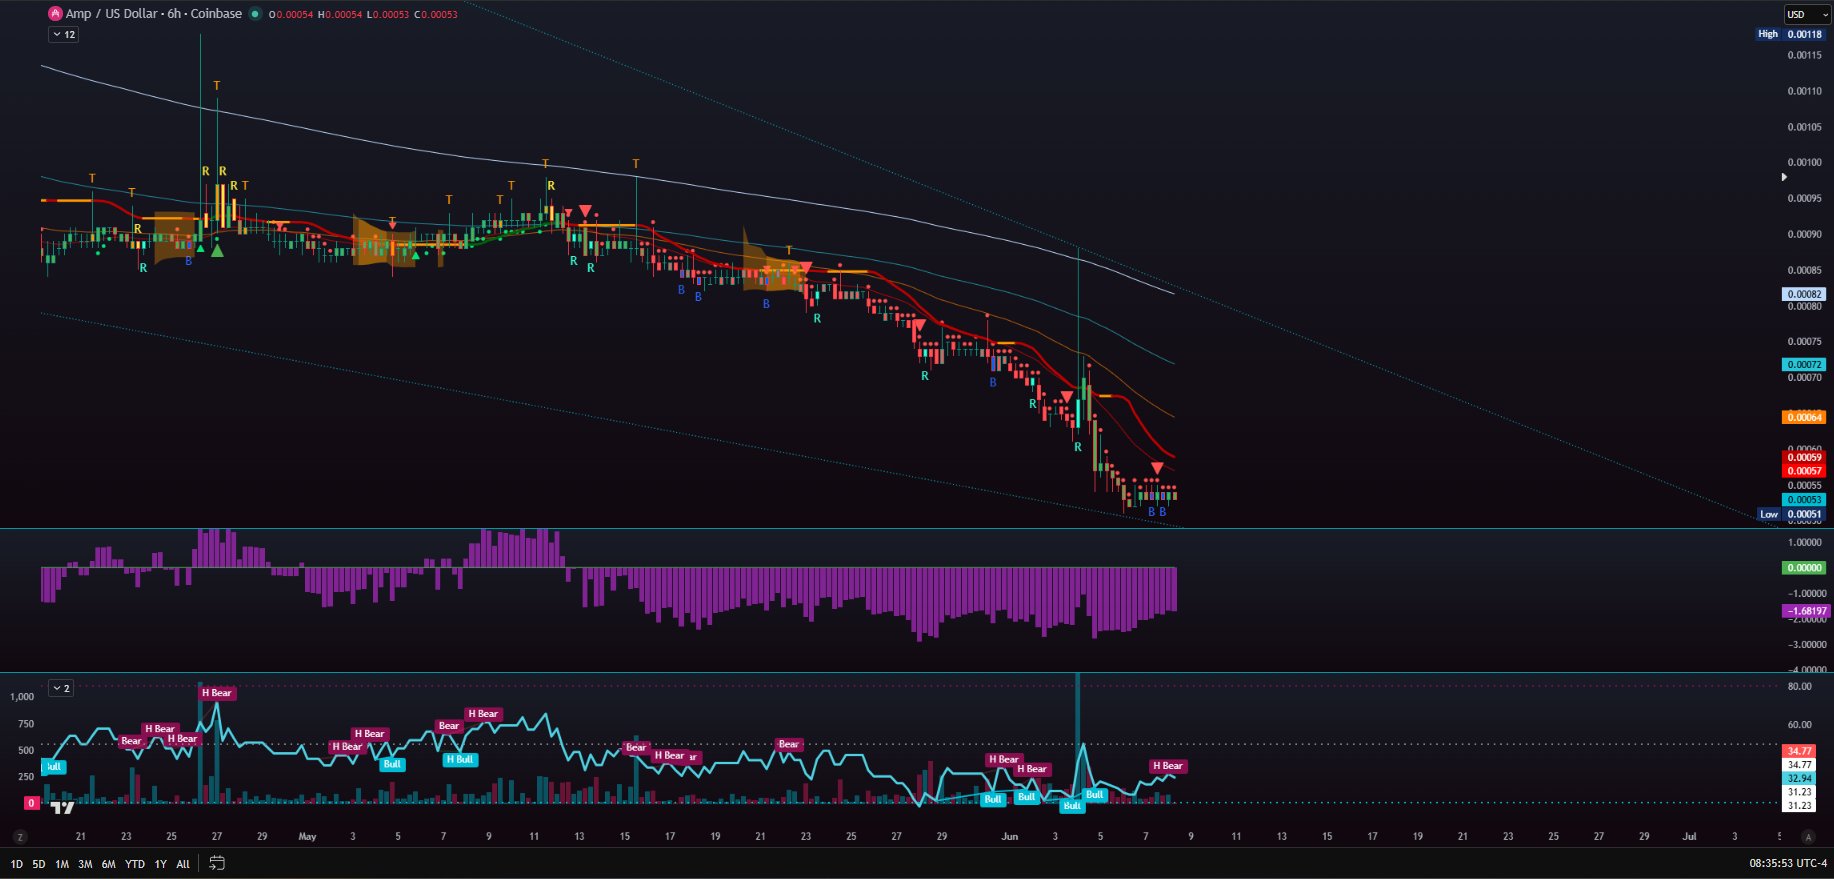
AMP chart shows a breakout above resistance, indicating significant upside potential.
0
0
0
2026-06-07 05:18
リリース後のAMPのトレンド
強気
AMP chart shows a breakout above resistance, indicating significant upside potential.
価格予測
AMPを購入するのに良い時期はいつですか?AMPは今買いでしょうか、売りでしょうか?
Amp(AMP)を購入または売却する適切な時期を決定する際は、まずご自身の取引戦略とリスクプロファイルに合わせることが重要です。長期投資家と短期トレーダーは市場状況を異なる方法で解釈することが多いため、決定には個人的なアプローチを反映すべきです。 最新の AMP 4時間テクニカル分析によると、現在の取引シグナルは ホールド です。 最新のAMP1日テクニカル分析によると、現在のシグナルはホールドです。

ビーコン予測
の確率的価格予測(今後24時間)ビーコン予測に関する免責事項
このページに表示されるデータ結果は、選択した取引ペアの実際の取引データ(OHLCV)と対応するテクニカル指標に基づいて分析されています。
この予測は実験的な技術的成果であり、あくまで参考目的で提供しています。これは投資アドバイスをではありません。現実世界での予期せぬ出来事が市場行動に大きな影響を与える可能性があります。トレーダーは慎重に意思決定を行うべきです。
この予測は実験的な技術的成果であり、あくまで参考目的で提供しています。これは投資アドバイスをではありません。現実世界での予期せぬ出来事が市場行動に大きな影響を与える可能性があります。トレーダーは慎重に意思決定を行うべきです。
アプリバージョン Amp
Amp (AMP) is a cryptocurrency launched in 2020and operates on the Ethereum platform. Amp has a current supply of 99,720,238,122.28571238 with 86,781,193,103.18022 in circulation. The last known price of Amp is 0.00053037 USD and is down -0.72 over the last 24 hours. It is currently trading on 188 active market(s) with $7,906,755.96 traded over the last 24 hours. More information can be found at https://amp.xyz.
続きを読む


購入 AMP
取引 AMP