

Woke up to my neighbor’s rooster at 5:12 AM, immediately checked charts on my cracked Android while chain-smoking on the porch steps.
My “retirement plan” is just more sats and prayer.
Family thinks I’m gambling again.
Bitcoin’s turning this broke-ass bloodline around while they still argue over who gets grandma’s broken riding mower.
Rewards
Futures Daily Draw
100% Chance To Win With Daily Trades
現物の日次のドロー
Win 8,888 USDT In Grand Prizes
ステークして投票
投票してエアドロップを獲得
機関
プロなかつ専門的なサービス対応
BitMart VIP
限定報酬のロック解除
アカデミー
トレードとブロックチェーンについて
BitMart Internship
Start your Crypto Career Here
BitMart Travel
ワンストップグローバルトラベルサービス
モバイルチャージ
モバイルを簡単に、オンラインで、安全にチャージ
Send
Send money globally, fast and secure
BitMartモール
Live on crypto
Bullish Trump Coin BTC 価格履歴 USD
Bullish Trump Coinの今日、7日間、30日間、90日間の価格を追跡
期間
24H変動幅
24H変動率 (%)
本日
$ 271.51
-0.42%
7日
$ 1,754.14
-2.67%
30日
$ 13,597.09
-17.54%
90日
$ 3,862.36
-5.70%
BTCを今すぐ所有
BitMartでBTCを簡単に安全に売買できます。
Bullish Trump Coin 相場情報
$ 63,215.84 24H変動幅 $ 64,513.95
過去最高値
$ 126,065.76
過去最安値
$ 631.33
24H変動幅
-0.31%
24H取引高
$ 126,973,430.31
供給量
20.04M
BTC
時価総額
$ 1.28T
最大供給量
21.00M
BTC
完全希薄化後時価総額
$ 1.34T
取引 BTC
Bullish Trump Coin Xインサイト

Adam Livingston
FA_Analyst
Influencer
A
 82.9K @AdamBLiv
 強気
Bitcoin helps families turn things around, outlook looks positive
 0
0
 0
0
 143
143
2026-06-22 00:33
リリース後のBTCのトレンド
強気
Bitcoin helps families turn things around, outlook looks positive

The Bitcoin Historian
Media
Influencer
C
214.8K @pete_rizzo_ 非常に強気
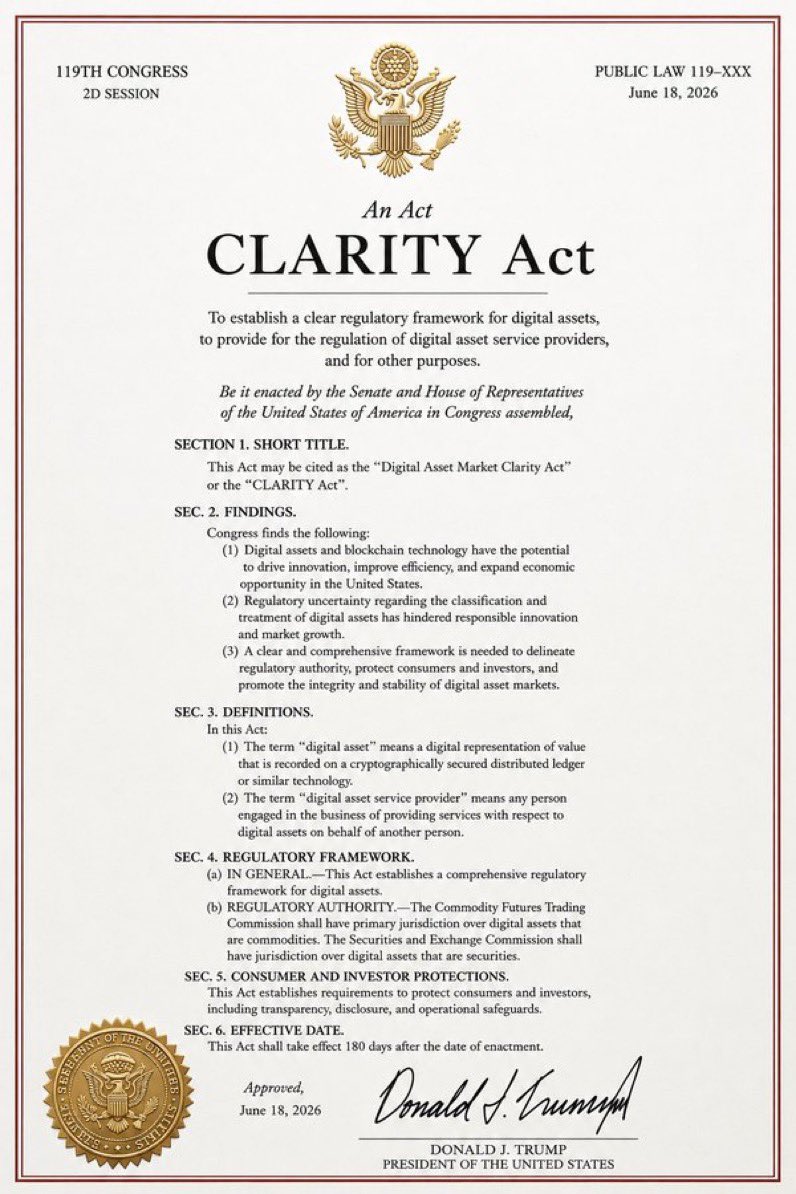
The US Senate will finalize the Crypto Clarity Act, bringing regulatory clarity to the digital asset market.
The Bitcoin Historian
Media
Influencer
C
214.8K @pete_rizzo_ LATEST: US SENATE WILL MEET TO FINALIZE THE #BITCOIN AND CRYPTO CLARITY ACT THIS WEEK
LIKE, IF YOU WANT TRUMP TO SIGN THIS BILL IMMEDIATELY 🔥 https://t.co/tLioaF8GIW
 35
2
2.6K
35
2
2.6K
2026-06-22 00:32
リリース後のBTCのトレンド
非常に強気
The US Senate will finalize the Crypto Clarity Act, bringing regulatory clarity to the digital asset market.

吴说区块链
Media
Educator
D
177.6K @wublockchain12 非常に弱気
A large amount of short positions indicate a pessimistic outlook on BTC, SOL, and ETH.
According to monitoring by Onchain Lens, the newly created wallet 0xaea deposited 6.68 million USDC into Hyperliquid and opened short positions with 20× leverage, including 430.64 BTC (approximately $27 million), 181,245 SOL (approximately $13 million) and 4,280 ETH (approximately $7 million).
https://t.co/J6xgKkXdXQ
0
0
359
2026-06-22 00:32
リリース後のBTCのトレンド
弱気
A large amount of short positions indicate a pessimistic outlook on BTC, SOL, and ETH.
価格予測
BTCを購入するのに良い時期はいつですか?BTCは今買いでしょうか、売りでしょうか?
Bullish Trump Coin(BTC)を購入または売却する適切な時期を決定する際は、まずご自身の取引戦略とリスクプロファイルに合わせることが重要です。長期投資家と短期トレーダーは市場状況を異なる方法で解釈することが多いため、決定には個人的なアプローチを反映すべきです。 最新のBTC1日テクニカル分析によると、現在のシグナルはホールドです。

ビーコン予測
の確率的価格予測(今後24時間)ビーコン予測に関する免責事項
このページに表示されるデータ結果は、選択した取引ペアの実際の取引データ(OHLCV)と対応するテクニカル指標に基づいて分析されています。
この予測は実験的な技術的成果であり、あくまで参考目的で提供しています。これは投資アドバイスをではありません。現実世界での予期せぬ出来事が市場行動に大きな影響を与える可能性があります。トレーダーは慎重に意思決定を行うべきです。
この予測は実験的な技術的成果であり、あくまで参考目的で提供しています。これは投資アドバイスをではありません。現実世界での予期せぬ出来事が市場行動に大きな影響を与える可能性があります。トレーダーは慎重に意思決定を行うべきです。
よくある質問
How Many Bitcoins Are There?
How Much Is Bitcoin Today?
What Is Bitcoin Mining?
アプリバージョン Bullish Trump Coin
ビットコイン(BTC)は、2008年に関連論文を発表し、2009年にオープンソースソフトウェアとしてリリースしたサトシ・ナカモトによって発明されたデジタル資産および決済システムである。このシステムはピアツーピアを特徴としており、ユーザーは仲介者を介さずに直接取引を行うことができる。取引はネットワークノードによって検証され、ブロックチェーンと呼ばれる公開分散型台帳に記録される。台帳はビットコインを単位とする。このシステムは中央リポジトリや単一の管理者なしで機能するため、米国財務省はビットコインを分散型仮想通貨に分類している。ビットコインはしばしば最初の暗号通貨と呼ばれるが、それ以前のシステムも存在していた。ビットコインはより正確には、最初の分散型暗号通貨と表現される。現在、この種の通貨の中で最大の時価総額を誇っている。
続きを読む
SNS


購入 BTC
取引 BTC