
Canaan Inc (CAN) announced that it will acquire a 49% stake in Cipher Mining (CIFR) owned by ABC Projects (Alborz LLC, Bear LLC, Chief Mountain LLC) by issuing 806.4 million Class A common shares (equivalent to 53.8 million American Depositary Receipts). The transaction amount is $39.75 million, and the shares are subject to a six‑month lock‑up period. (CoinDesk)
https://t.co/fLgaYUcy2k
Rewards
Futures Daily Draw
100% Chance To Win With Daily Trades
現物の日次のドロー
Win 8,888 USDT In Grand Prizes
ステークして投票
投票してエアドロップを獲得
機関
プロなかつ専門的なサービス対応
BitMart VIP
限定報酬のロック解除
アカデミー
トレードとブロックチェーンについて
BitMart Internship
Start your Crypto Career Here
BitMart Travel
ワンストップグローバルトラベルサービス
モバイルチャージ
モバイルを簡単に、オンラインで、安全にチャージ
Send
Send money globally, fast and secure
BitMartモール
Live on crypto

Channels (CAN)
$ 0.00022 (CAN/USD)
0.00%
24H
Channels CAN 価格履歴 USD
Channelsの今日、7日間、30日間、90日間の価格を追跡
期間
24H変動幅
24H変動率 (%)
本日
$ 0
0.00%
7日
$ 0.0000099
-4.17%
30日
$ 0.000049
-17.86%
90日
$ 0.000019
-8.00%
CANを今すぐ所有
BitMartでCANを簡単に安全に売買できます。
Channels 相場情報
$ 0.00022 24H変動幅 $ 0.00022
過去最高値
$ 92.26
過去最安値
$ 0.00012
24H変動幅
0.00%
24H取引高
$ 142.67
供給量
0.00
CAN
時価総額
$ 0
最大供給量
1.00B
CAN
完全希薄化後時価総額
$ 229.65K
取引 CAN
Channels Xインサイト

吴说区块链
Media
Educator
D
 177.6K @wublockchain12
 中立
Canaan acquires 49% stake in Cipher Mining with the issuance of 806.4 million shares, transaction amount $39.75 million
 1
1
 1
1
 358
358
2026-02-24 11:21
リリース後のCANのトレンド
中立
Canaan acquires 49% stake in Cipher Mining with the issuance of 806.4 million shares, transaction amount $39.75 million

Ace of Trades
TA_Analyst
Trader
C
14.6K @acethebullly 中立
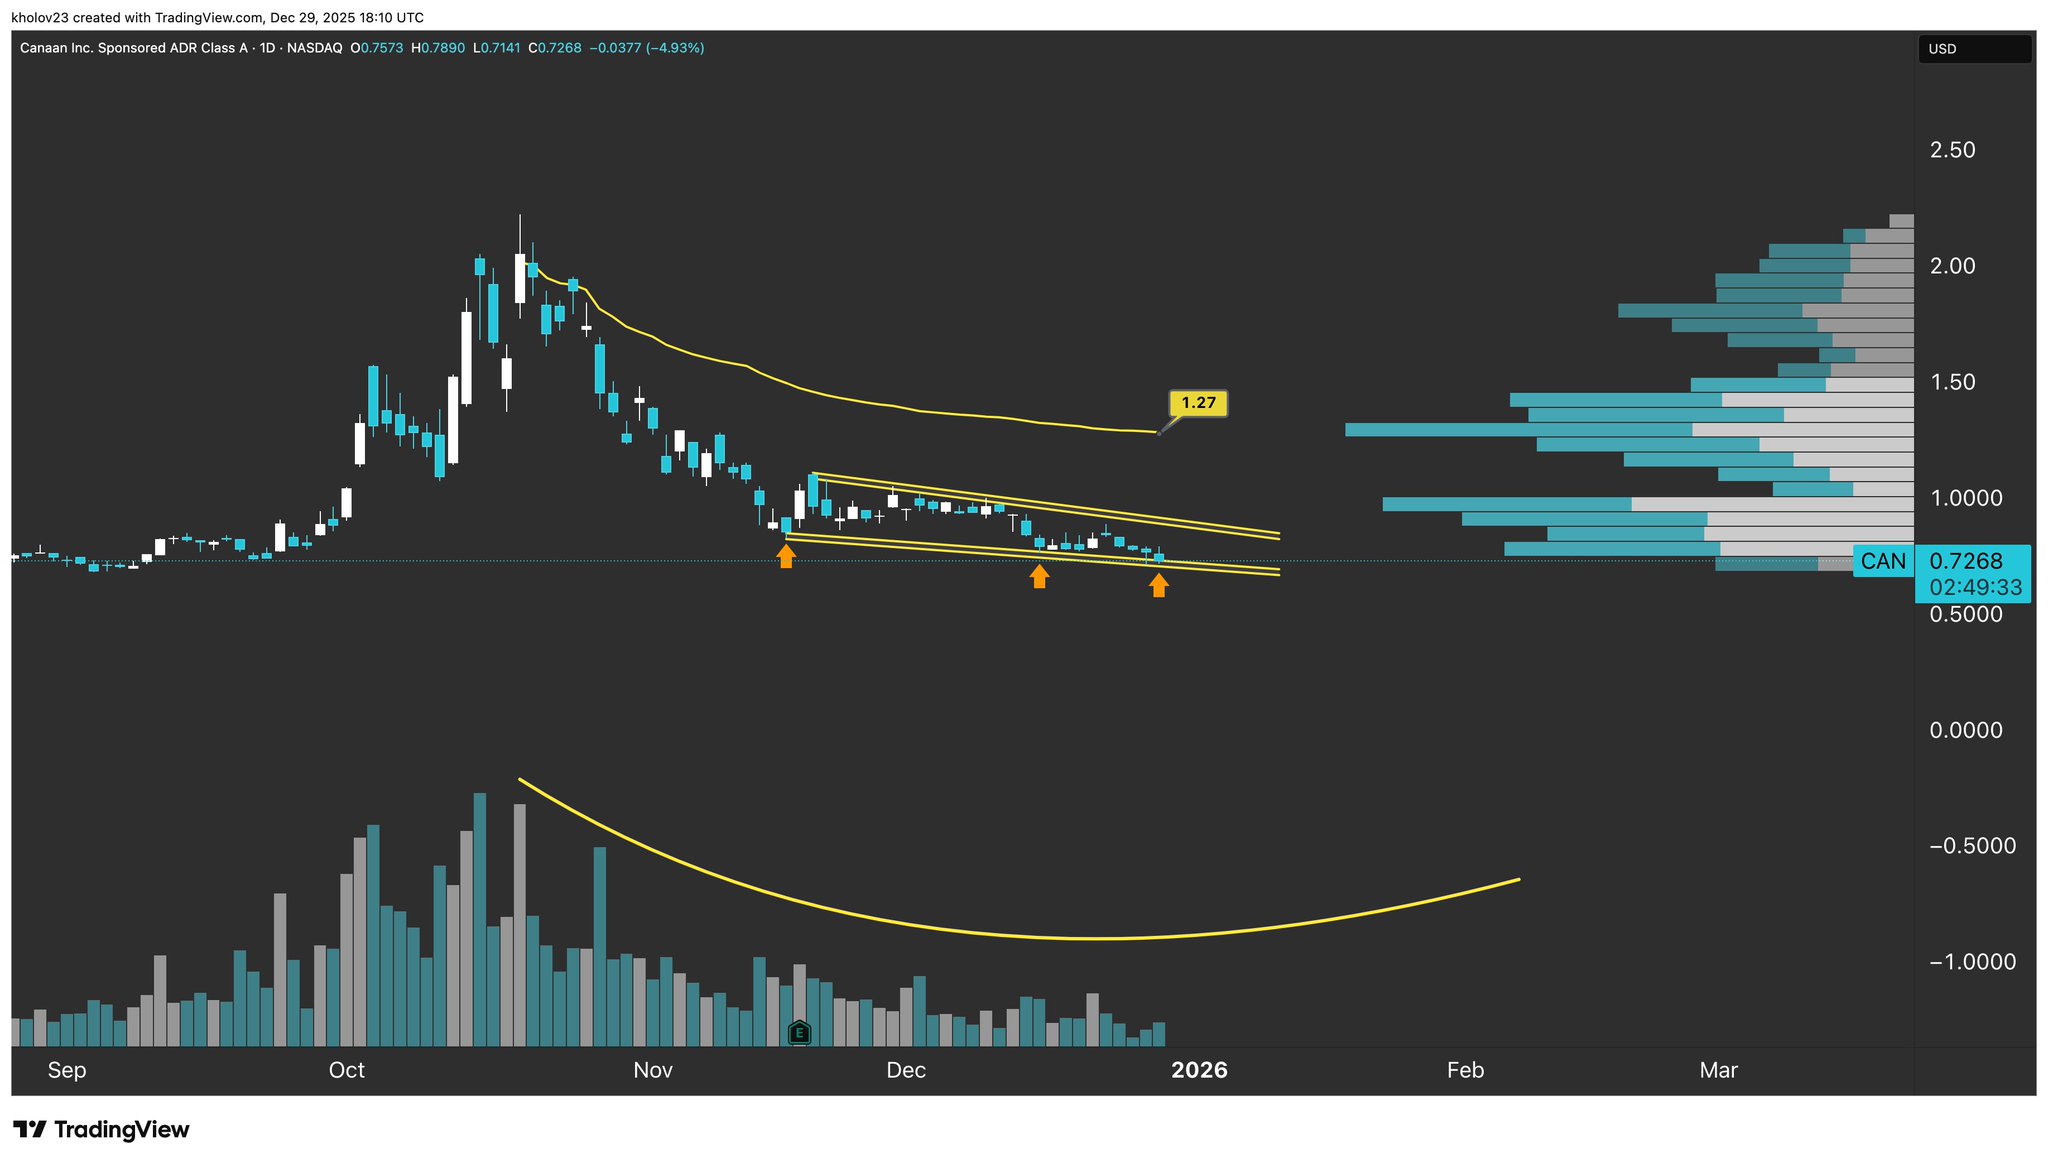
CAN price has touched the descending channel support level for the third time, indicating a potential technical rebound opportunity.
$CAN

Mr Chart Norris D
20.1K @kholov23 $CAN Daily Candle Chart
Thats your THIRD touch
 7
1
2.2K
7
1
2.2K
2025-12-29 23:27
リリース後のCANのトレンド
中立
CAN price has touched the descending channel support level for the third time, indicating a potential technical rebound opportunity.
Ace of Trades
TA_Analyst
Trader
C
14.6K @acethebullly 強気
CAN is consolidating in the 0.87‑1.03 range, fundamentals are favorable, and short-term support remains.
Stop crying 😭
This guy just handed all his gains back on a silver platter.
Classic bag holder move 🤣🤣

Ali Hshrof | ₿ D
349 @Ali_hashroof The chart read is incomplete. $CAN isn’t in a “full bearish alignment” — it’s in a low-volume accumulation range.
Price has been moving sideways between $0.87–$1.03, which is classic post-capitulation basing, not institutional selling. Distribution requires surging volume and breakdown candles — none of which are present. The flattening volatility, thin Ichimoku cloud, and neutral OBV all point to absorption, not rejection.
Calling it a downtrend across all timeframes ignores the fundamental catalysts now stacking beneath the chart:
• Frost & Sullivan ranks Canaan #2 globally in ASIC compute power
• Q3 revenue beat expectations with strong YoY growth
• New partnerships: SynVista Energy (green compute + AI load balancing) and SLNH hosting
• Expanding footprint: Canada, Japan, Ethiopia, North America
• Zero meaningful short interest + 106 institutional holders
• Active share-buyback program
• Industry shift toward efficient ASIC compute (AI + BTC heat-reuse + clean-power mining)
These are not the signals of
0
0
360
2025-12-04 21:57
リリース後のCANのトレンド
強気
CAN is consolidating in the 0.87‑1.03 range, fundamentals are favorable, and short-term support remains.
価格予測
CANを購入するのに良い時期はいつですか?CANは今買いでしょうか、売りでしょうか?
Channels(CAN)を購入または売却する適切な時期を決定する際は、まずご自身の取引戦略とリスクプロファイルに合わせることが重要です。長期投資家と短期トレーダーは市場状況を異なる方法で解釈することが多いため、決定には個人的なアプローチを反映すべきです。 最新の CAN 4時間テクニカル分析によると、現在の取引シグナルは ホールド です。 最新のCAN1日テクニカル分析によると、現在のシグナルはホールドです。

ビーコン予測
の確率的価格予測(今後24時間)ビーコン予測に関する免責事項
このページに表示されるデータ結果は、選択した取引ペアの実際の取引データ(OHLCV)と対応するテクニカル指標に基づいて分析されています。
この予測は実験的な技術的成果であり、あくまで参考目的で提供しています。これは投資アドバイスをではありません。現実世界での予期せぬ出来事が市場行動に大きな影響を与える可能性があります。トレーダーは慎重に意思決定を行うべきです。
この予測は実験的な技術的成果であり、あくまで参考目的で提供しています。これは投資アドバイスをではありません。現実世界での予期せぬ出来事が市場行動に大きな影響を与える可能性があります。トレーダーは慎重に意思決定を行うべきです。
アプリバージョン Channels
Channels (CAN) is a cryptocurrency launched in 2021and operates on the BNB Smart Chain (BEP20) platform. Channels has a current supply of 1,000,000,000 with 0 in circulation. The last known price of Channels is 0.00022816 USD and is down -0.88 over the last 24 hours. It is currently trading on 20 active market(s) with $59.93 traded over the last 24 hours. More information can be found at https://bsc.channels.finance/.
続きを読む
Chain explorer
さらに詳しく
BM Discovery


新規上場

APLDON Applied Digital
-- 0.00%

NEEON NextEra Energy
-- 0.00%

ONON ON Semiconductor Corporation
-- 0.00%

SCHWON The Charles Schwab Corporation
-- 0.00%

ANSEM The Black Bull
-- 0.00%

CIFRON Cipher Mining Inc.
-- 0.00%

WULFON TeraWulf Inc.
-- 0.00%

PINSON Pinterest, Inc.
-- 0.00%

HPEON Hewlett Packard Enterprise Co
-- 0.00%

PCGON PG&E
-- 0.00%