

It seems there are people who have seriously bet their lives on EdgeX... I guess it's doomed after all...
Rewards
Futures Daily Draw
100% Chance To Win With Daily Trades
現物の日次のドロー
Win 8,888 USDT In Grand Prizes
ステークして投票
投票してエアドロップを獲得
機関
プロなかつ専門的なサービス対応
BitMart VIP
限定報酬のロック解除
アカデミー
トレードとブロックチェーンについて
BitMart Internship
Start your Crypto Career Here
BitMart Travel
ワンストップグローバルトラベルサービス
モバイルチャージ
モバイルを簡単に、オンラインで、安全にチャージ
Send
Send money globally, fast and secure
BitMartモール
Live on crypto
Edge Network EDGE 価格履歴 USD
Edge Networkの今日、7日間、30日間、90日間の価格を追跡
期間
24H変動幅
24H変動率 (%)
本日
$ 0
0.00%
7日
--
--
30日
--
--
90日
--
--
EDGEを今すぐ所有
BitMartでEDGEを簡単に安全に売買できます。
Edge Network 相場情報
$ 0.059 24H変動幅 $ 0.069
過去最高値
$ 0
過去最安値
$ 0
24H変動幅
0.00%
24H取引高
$ 3,569.82
供給量
--
時価総額
$ 0
最大供給量
1.00B
EDGE
完全希薄化後時価総額
$ 59.92M
取引 EDGE
Edge Network Xインサイト

コゴロー.lens🐐(📽️, 🌿)(🌸, 🌿)♦️.ink
TA_Analyst
Influencer
B
 2.2K @2AkuqpZMLTmvHBW
 非常に弱気
EDGE fell to $0.2, approaching $0.1, outlook is bleak.

バンケラ🇯🇵情報屋エアドロップ仮想通貨Airdropビットコイン D
34.3K @BankeraDao [Breaking] $EDGE token finally plummets to the $0.2 range
No development progress; while loudly denying insider speculation, there’s been no communication afterward
Some are saying it might be close to $0.1.
 7
7
 2
2
 3.2K
3.2K
2026-06-27 10:47
リリース後のEDGEのトレンド
弱気
EDGE fell to $0.2, approaching $0.1, outlook is bleak.

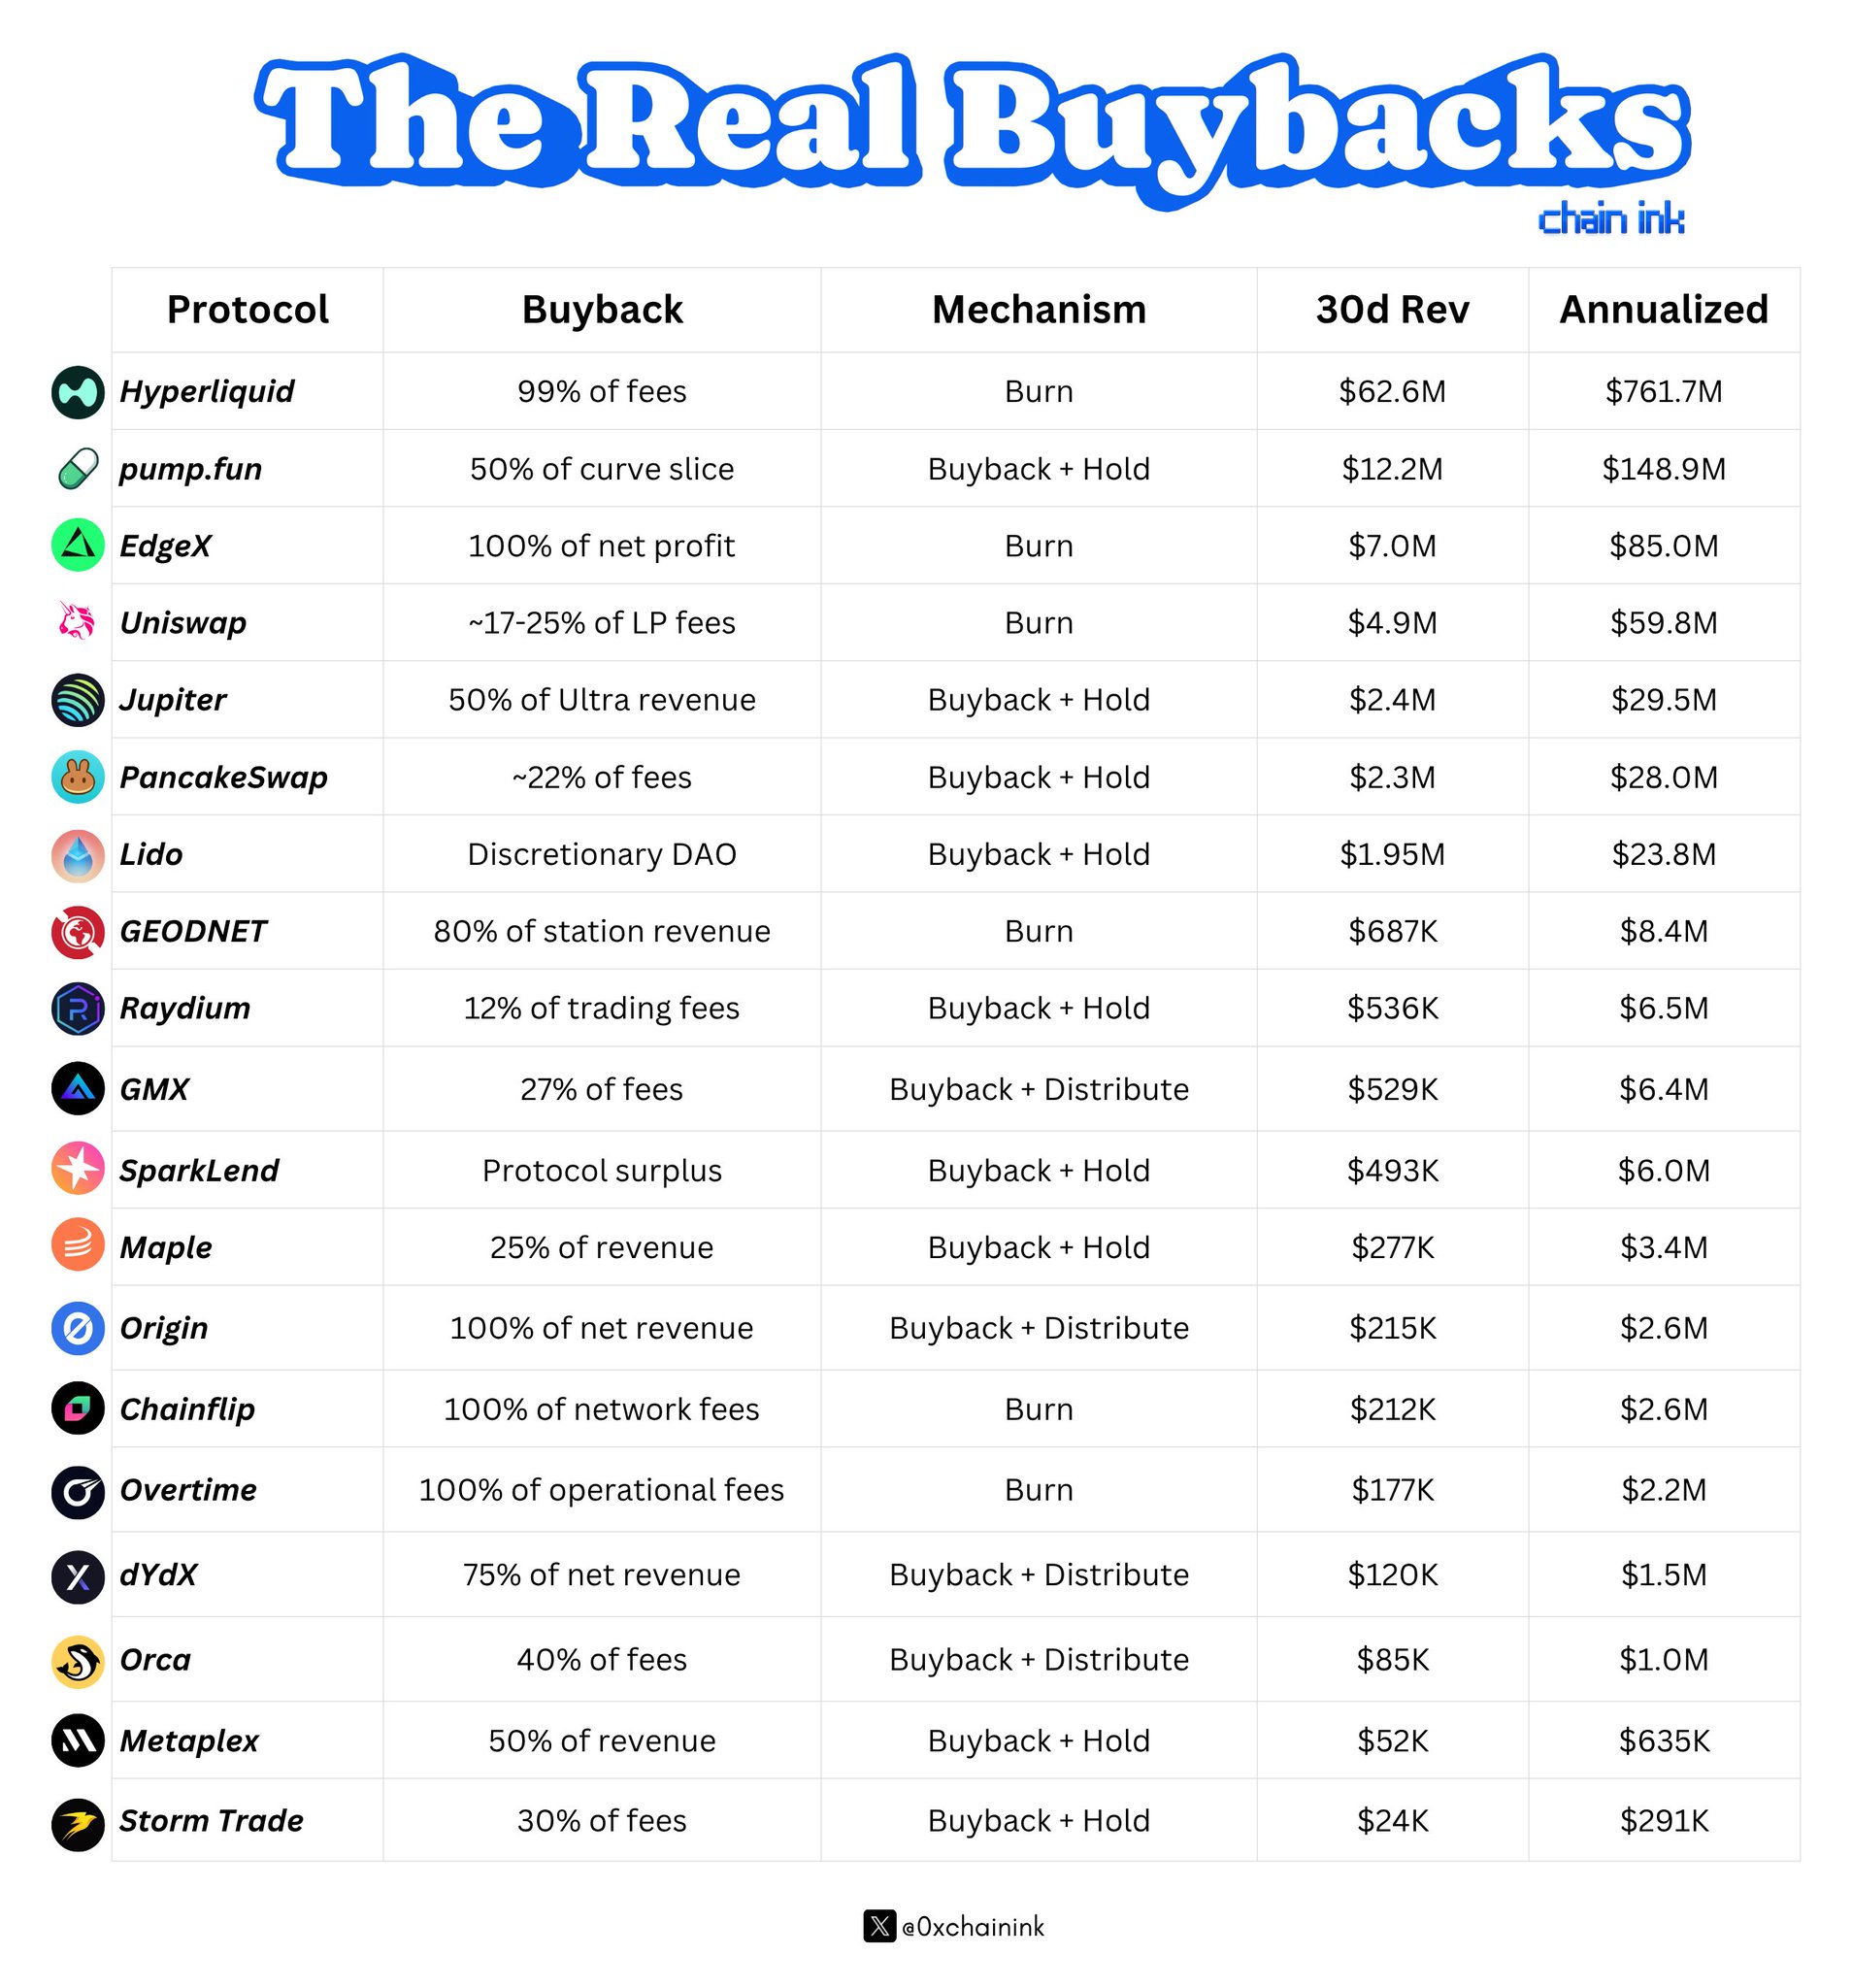
Chain INK S
6.7K @0xchainink 強気
DeFi projects demonstrate strong fundamentals through token burn and buy‑back mechanisms, especially the six projects with high burn rates.
Hardest Burns in DeFi 👇
% of market cap bought back and destroyed every year
$EDGE → 64.5%
$OVER → 30.0%
$GEOD → 9.7%
$FLIP → 9.7%
$HYPE → 5.1%
$UNI → 3.2%
The whole market prints. These six burn. https://t.co/J2SthPM5TT
 64
0
4.9K
64
0
4.9K
2026-06-26 16:57
リリース後のEDGEのトレンド
強気
DeFi projects demonstrate strong fundamentals through token burn and buy‑back mechanisms, especially the six projects with high burn rates.

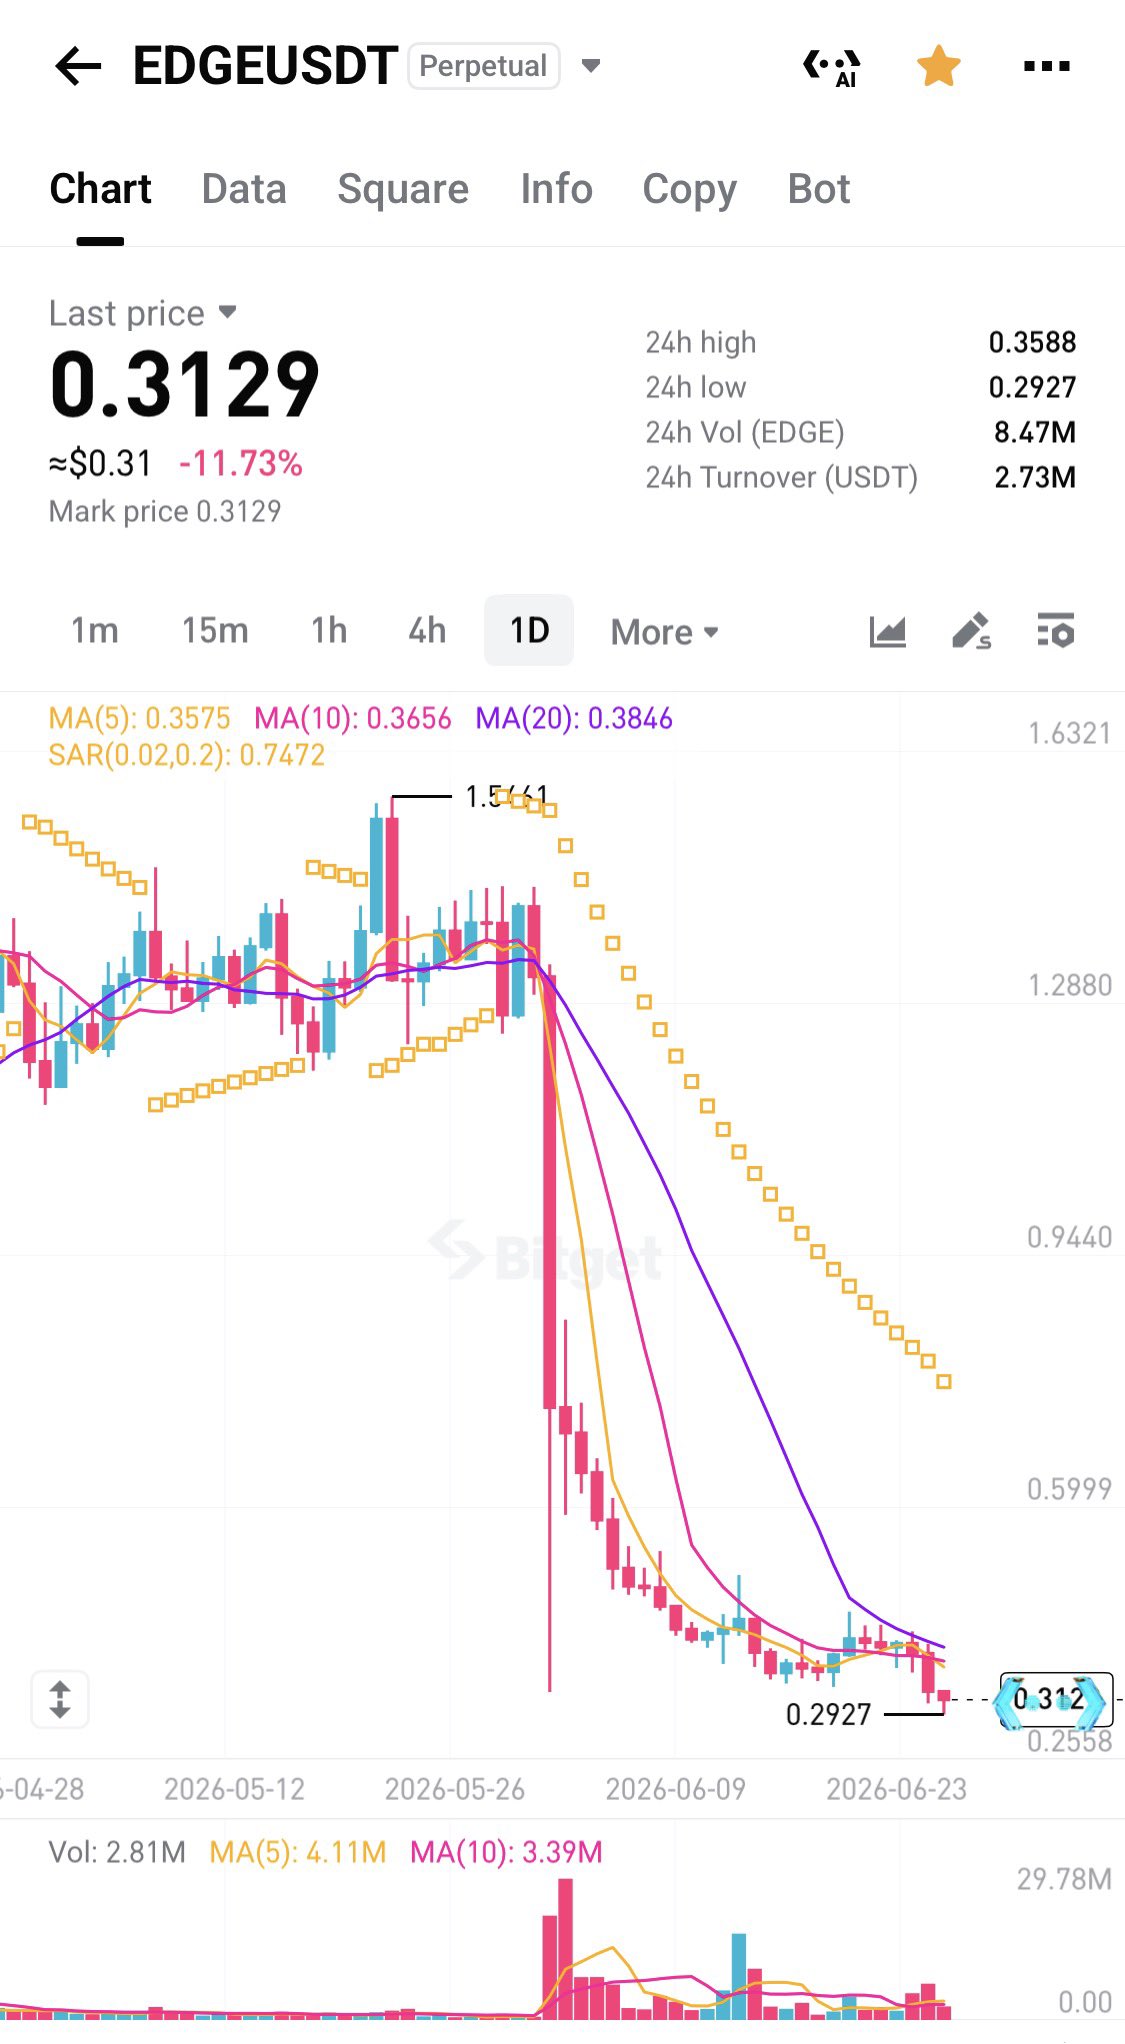
레오.마스터
Trader
Derivatives_Expert
C
14.0K @ezeroho8245 非常に弱気
The EDGE coin daily chart shows the price continuously dropping sharply, and technical indicators are all bearish.
EGDE X
Daily chart.
It's typical https://t.co/0WiaBAXGrk
 6
1
846
6
1
846
2026-06-26 09:57
リリース後のEDGEのトレンド
弱気
The EDGE coin daily chart shows the price continuously dropping sharply, and technical indicators are all bearish.
価格予測
EDGEを購入するのに良い時期はいつですか?EDGEは今買いでしょうか、売りでしょうか?
Edge Network(EDGE)を購入または売却する適切な時期を決定する際は、まずご自身の取引戦略とリスクプロファイルに合わせることが重要です。長期投資家と短期トレーダーは市場状況を異なる方法で解釈することが多いため、決定には個人的なアプローチを反映すべきです。 最新の EDGE 4時間テクニカル分析によると、現在の取引シグナルは ホールド です。

ビーコン予測
の確率的価格予測(今後24時間)ビーコン予測に関する免責事項
このページに表示されるデータ結果は、選択した取引ペアの実際の取引データ(OHLCV)と対応するテクニカル指標に基づいて分析されています。
この予測は実験的な技術的成果であり、あくまで参考目的で提供しています。これは投資アドバイスをではありません。現実世界での予期せぬ出来事が市場行動に大きな影響を与える可能性があります。トレーダーは慎重に意思決定を行うべきです。
この予測は実験的な技術的成果であり、あくまで参考目的で提供しています。これは投資アドバイスをではありません。現実世界での予期せぬ出来事が市場行動に大きな影響を与える可能性があります。トレーダーは慎重に意思決定を行うべきです。
アプリバージョン Edge Network
Edge Network (EDGE) is a cryptocurrency launched in 2021and operates on the Ethereum platform. Edge Network has a current supply of 57,091,381.571887 with 0 in circulation. The last known price of Edge Network is 0.07548225 USD and is down -1.57 over the last 24 hours. It is currently trading on 23 active market(s) with $0.00 traded over the last 24 hours. More information can be found at https://edge.network.
続きを読む
公式リンク
Chain explorer
さらに詳しく
BM Discovery


新規上場

SOXLON Direxion Daily Semi Bull 3X ETF
-- 0.00%

NIOON NIO
-- 0.00%

HYGON iBoxx $ High Yield Corporate Bond ETF
-- 0.00%

AURON Aurora Innovation
-- 0.00%

IGVON iShares Expanded Tech-Software ETF
-- 0.00%

SQQQON ProShares UltraPro Short QQQ
-- 0.00%

IBITON iShares Bitcoin Trust ETF
-- 0.00%

AMCON AMC Entertainment Holdings
-- 0.00%

GRABON Grab Holdings
-- 0.00%

SNAPON Snap(Ondo)
-- 0.00%
購入 EDGE
取引 EDGE