#gns
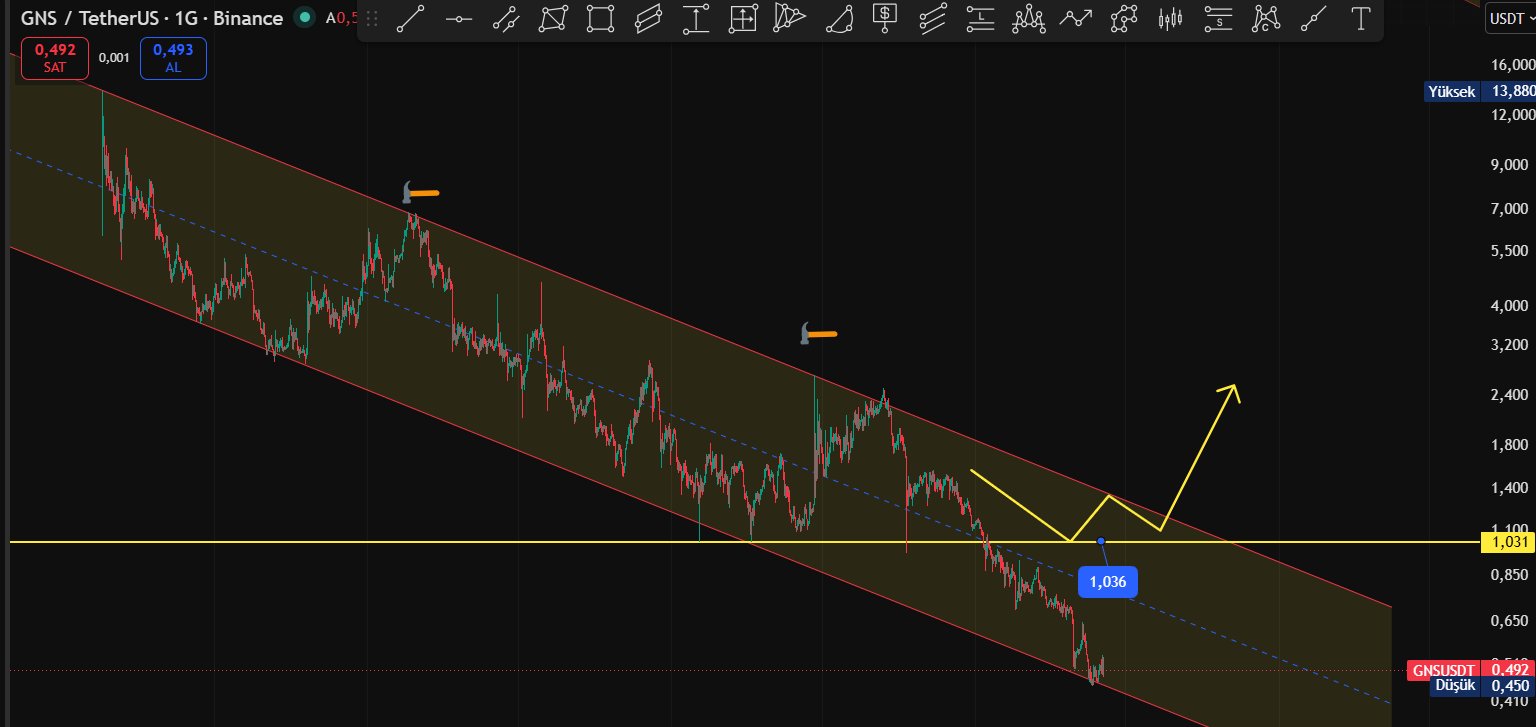
The channel has reached its lower band. Under normal conditions, I expect a reaction at these levels.
It appears to be holding at 045. Need to watch a bit longer. https://t.co/33G1YDdCbd


 27.8K @Cyriptoman4
 #gns
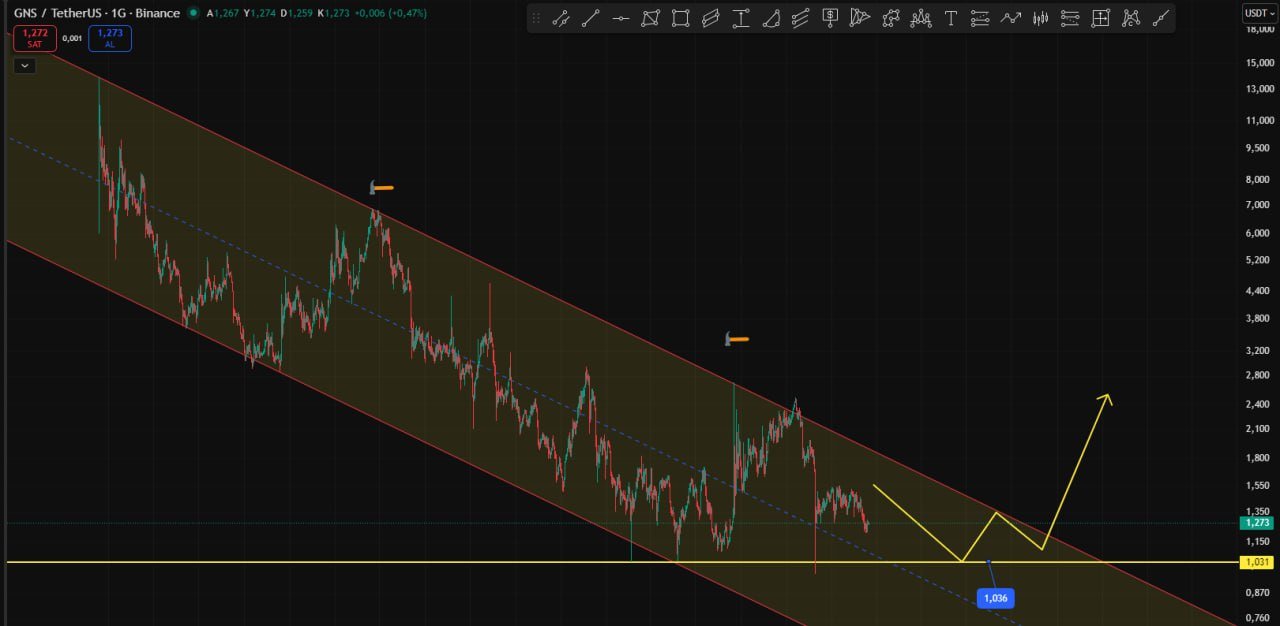
The channel has reached its lower band. Under normal conditions, I expect a reaction at these levels.
It appears to be holding at 045. Need to watch a bit longer. https://t.co/33G1YDdCbd
 54
54
 2
2
 1.0K
27.8K @Cyriptoman4
1.0K
27.8K @Cyriptoman4 #gns
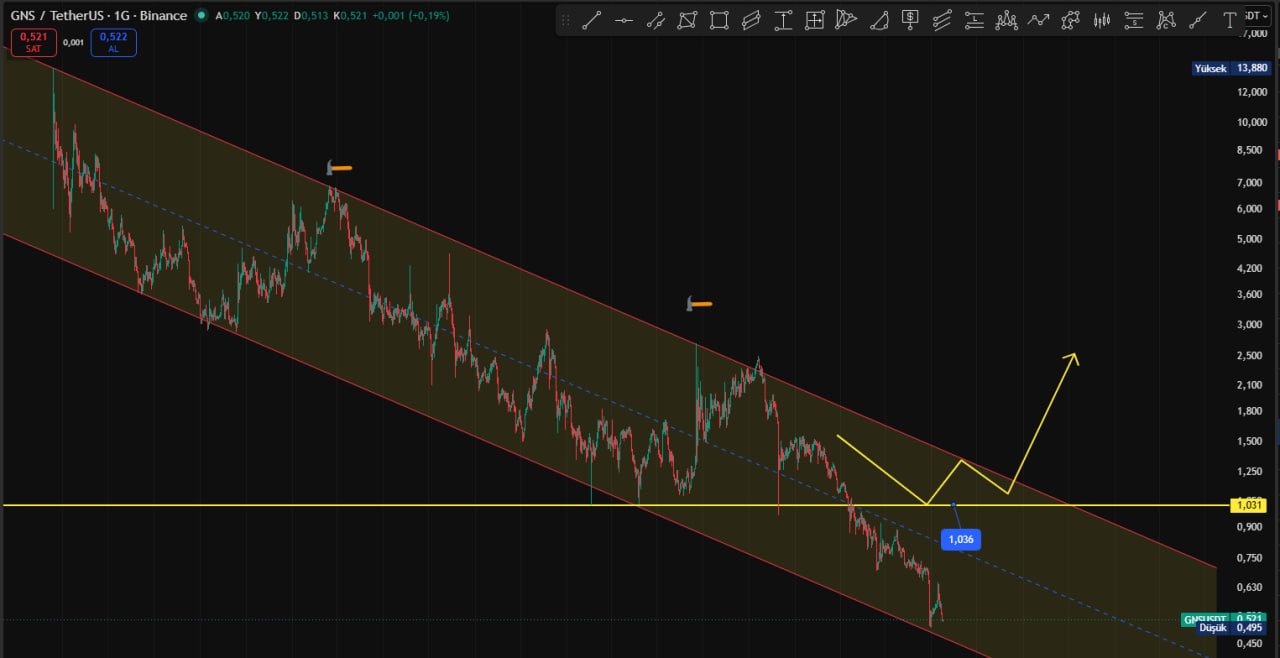
I expected a pullback from $1.45 to $1.
Now at $0.50
We got out of a serious loss.
A roughly 60% drop has occurred. Below the level I was following https://t.co/jCaYgBhkOj
 75
2
1.5K
75
2
1.5K
 177.6K @wublockchain12
 According to Wu, Bitcoin treasury company Genius Group (GNS) released a company update stating that in April 2026 it entered the regulated digital banking and stablecoin issuance sector by holding a 9.9% equity stake in the Bermuda dual-license digital bank Jewel Bank. Jewel Bank holds a banking license from the Bermuda Monetary Authority and a Class F digital asset business license, and the company says it is expected to become a licensed payment stablecoin issuer under the U.S. GENIUS Act. The company disclosed that Q1 2026 operating revenue grew 171% year-over-year, gross profit increased 228% year-over-year to $2 million, and it forecasts full-year 2026 revenue of $20 million to $22 million. https://t.co/kjLJQ4u16i
0
2
1.9K