
I just published **The No-Code Revolution is Here. And It’s Automated.**
#GraphLinq #NoCode #Blockchain #DeFi #Automation #Web3 #AI #GLQ
https://t.co/Q3T0k0lUzi
Rewards
Futures Daily Draw
100% Chance To Win With Daily Trades
現物の日次のドロー
Win 8,888 USDT In Grand Prizes
ステークして投票
投票してエアドロップを獲得
機関
プロなかつ専門的なサービス対応
BitMart VIP
限定報酬のロック解除
アカデミー
トレードとブロックチェーンについて
BitMart Internship
Start your Crypto Career Here
BitMart Travel
ワンストップグローバルトラベルサービス
モバイルチャージ
モバイルを簡単に、オンラインで、安全にチャージ
Send
Send money globally, fast and secure
BitMartモール
Live on crypto

Graphlinq Chain (GLQ)
$ 0.0025 (GLQ/USD)
-6.86%
24H
Graphlinq Chain ライブ価格データ
Graphlinq Chainの今日の価格は$ 0.0025 (GLQ/USD)です。 時価総額$ 876.17K USD、 24時間取引量$ 71,469.13 USD、 24時間の価格変動-6.86%、 そして流通供給量340.00M GLQ。
Graphlinq Chain GLQ 価格履歴 USD
Graphlinq Chainの今日、7日間、30日間、90日間の価格を追跡
期間
24H変動幅
24H変動率 (%)
本日
$ 0.00018
-6.86%
7日
$ 0.00012
-4.61%
30日
$ 0.0012
-32.58%
90日
$ 0.0012
-32.07%
GLQを今すぐ所有
BitMartでGLQを簡単に安全に売買できます。
Graphlinq Chain 相場情報
$ 0.0025 24H変動幅 $ 0.0027
過去最高値
$ 0.0084
過去最安値
$ 0.0025
24H変動幅
-6.86%
24H取引高
$ 71,469.13
供給量
340.00M
GLQ
時価総額
$ 876.17K
最大供給量
--
完全希薄化後時価総額
$ 1.68M
取引 GLQ
Graphlinq Chain Xインサイト

Crynet
Media
Researcher
D
 4.2K @crynetio
 強気
GLQ launches a no-code DeFi automation platform
 3
3
 1
1
 128
128
2025-11-15 16:14
リリース後のGLQのトレンド
強気
GLQ launches a no-code DeFi automation platform

Man of Bitcoin
TA_Analyst
Trader
B
9.3K @Manofbitcoin 強気
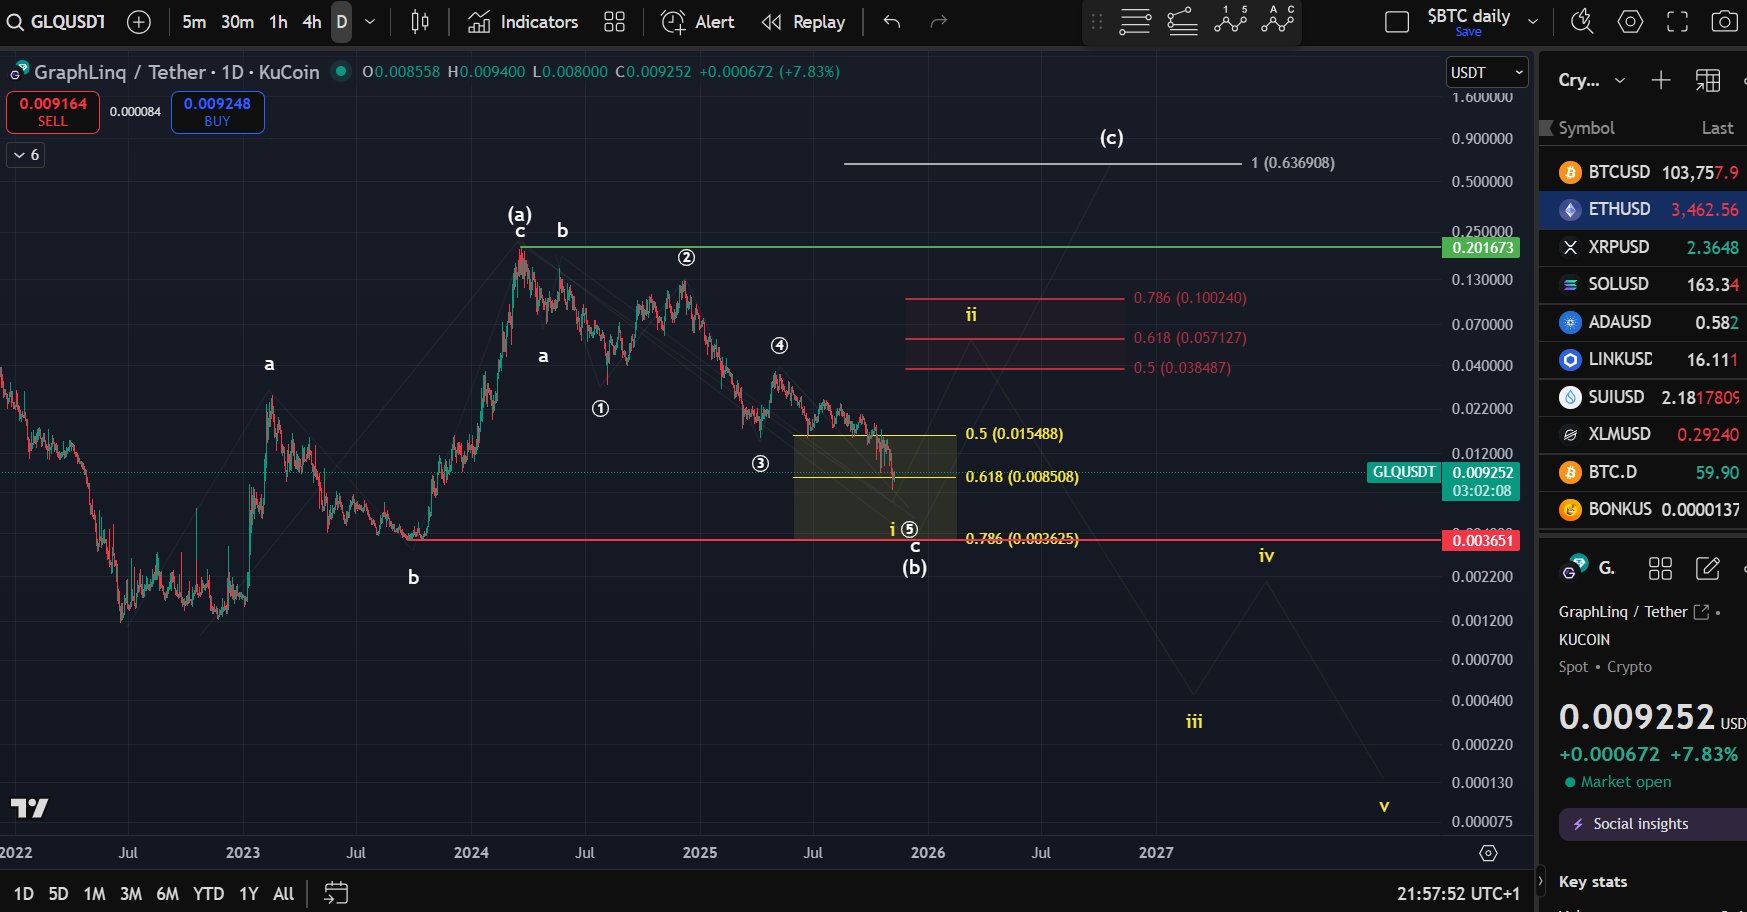
GLQ faces a potential 5-wave bearish decline scenario, but a break above the key resistance zone could lead to an ABC upward correction targeting $0.6369.
$GLQ (by request): A bearish scenario has been added due to the potential 5-wave decline. Resistance for a wave-ii high lies between $0.0384 and $0.1002.A break above this zone would suggest that a larger ABC correction is unfolding to the upside, with an ideal target near $0.6369.
 8
1
1.3K
8
1
1.3K
2025-11-07 21:04
リリース後のGLQのトレンド
強気
GLQ faces a potential 5-wave bearish decline scenario, but a break above the key resistance zone could lead to an ABC upward correction targeting $0.6369.
Man of Bitcoin
TA_Analyst
Trader
B
9.3K @Manofbitcoin 非常に弱気
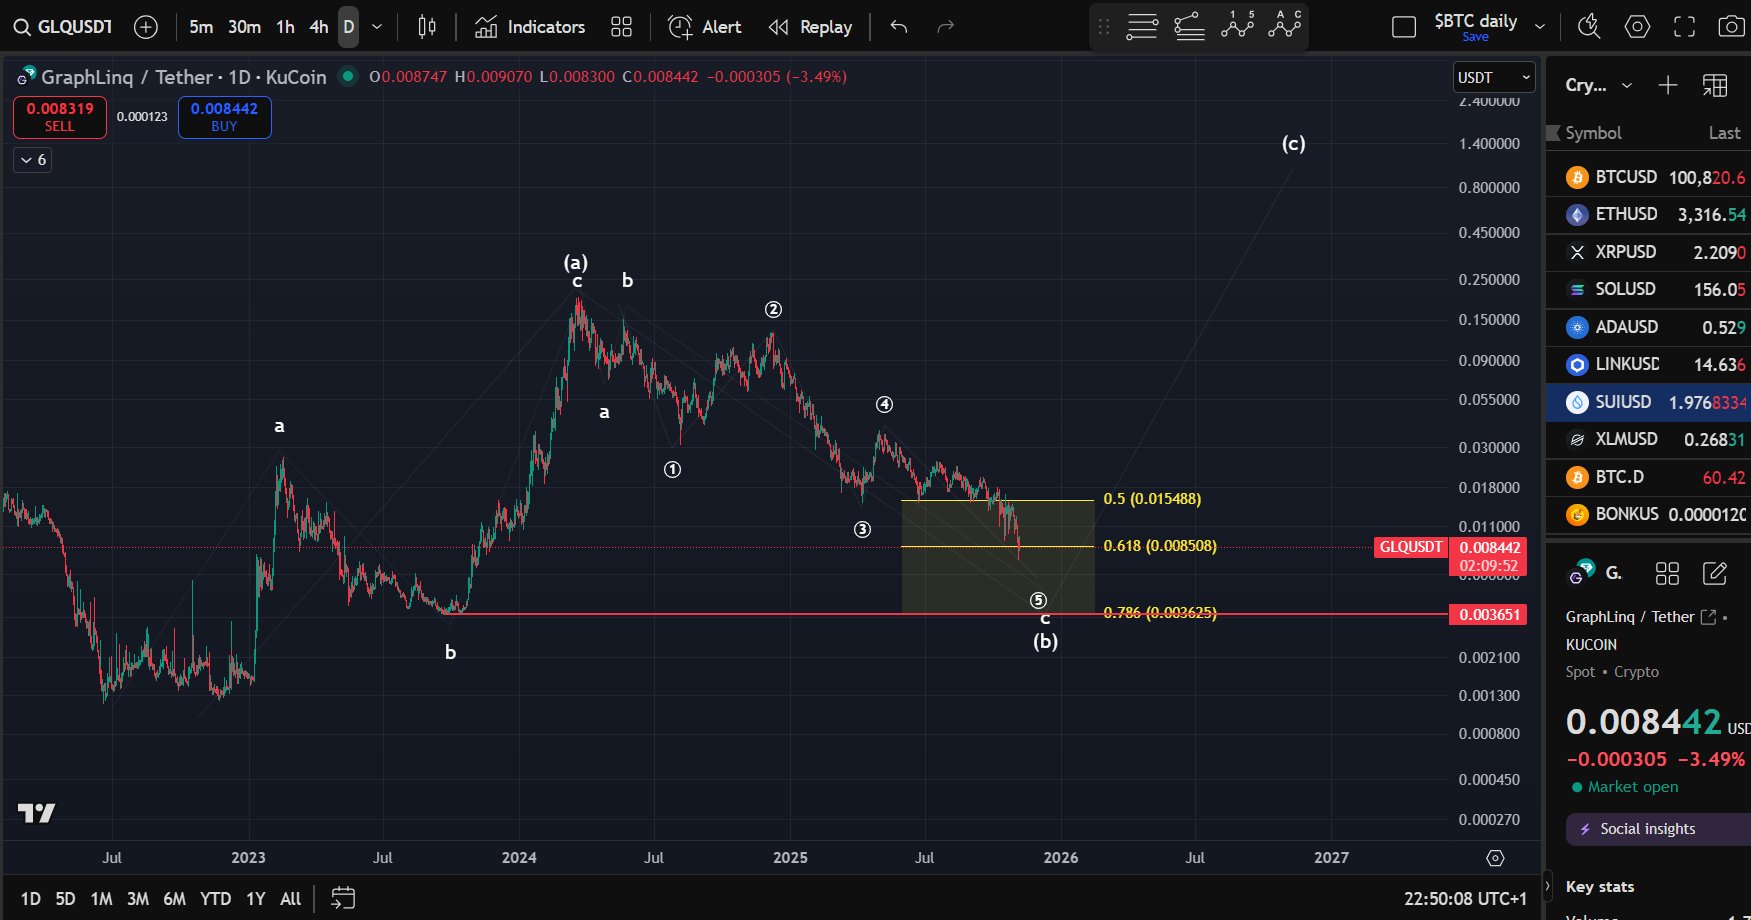
GLQ may be forming an ABC diagonal pattern, has touched the $0.0085 Fibonacci retracement level but the reaction is weak. If support breaks, $0.00365 is a potential reversal zone.
$GLQ: The price may be forming a large ABC diagonal pattern. It has already reached the 61.8% Fib retracement at $0.0085, but the reaction so far remains too weak to be reliable.
If support breaks, the $0.00365 level could serve as the next potential reversal zone. https://t.co/gUwzpKOUwG
 12
1
1.2K
12
1
1.2K
2025-11-06 21:54
リリース後のGLQのトレンド
弱気
GLQ may be forming an ABC diagonal pattern, has touched the $0.0085 Fibonacci retracement level but the reaction is weak. If support breaks, $0.00365 is a potential reversal zone.
価格予測
GLQを購入するのに良い時期はいつですか?GLQは今買いでしょうか、売りでしょうか?
Graphlinq Chain(GLQ)を購入または売却する適切な時期を決定する際は、まずご自身の取引戦略とリスクプロファイルに合わせることが重要です。長期投資家と短期トレーダーは市場状況を異なる方法で解釈することが多いため、決定には個人的なアプローチを反映すべきです。 最新の GLQ 4時間テクニカル分析によると、現在の取引シグナルは ホールド です。 最新のGLQ1日テクニカル分析によると、現在のシグナルはホールドです。

ビーコン予測
の確率的価格予測(今後24時間)ビーコン予測に関する免責事項
このページに表示されるデータ結果は、選択した取引ペアの実際の取引データ(OHLCV)と対応するテクニカル指標に基づいて分析されています。
この予測は実験的な技術的成果であり、あくまで参考目的で提供しています。これは投資アドバイスをではありません。現実世界での予期せぬ出来事が市場行動に大きな影響を与える可能性があります。トレーダーは慎重に意思決定を行うべきです。
この予測は実験的な技術的成果であり、あくまで参考目的で提供しています。これは投資アドバイスをではありません。現実世界での予期せぬ出来事が市場行動に大きな影響を与える可能性があります。トレーダーは慎重に意思決定を行うべきです。
アプリバージョン Graphlinq Chain
Graphlinq Chain (GLQ) is a cryptocurrency launched in 2021. Graphlinq Chain has a current supply of 650,000,000 with 339,999,895 in circulation. The last known price of Graphlinq Chain is 0.00277001 USD and is down -0.25 over the last 24 hours. It is currently trading on 52 active market(s) with $68,080.17 traded over the last 24 hours. More information can be found at https://graphlinq.io/.
続きを読む
Chain explorer
さらに詳しく
BM Discovery


新規上場

JAM JAM Coin
-- 0.00%

UMXM Manadia
-- 0.00%

UMCON United Microelectronics Tokenized Stock (Ondo)
-- 0.00%

AMKRON Amkor Technology Tokenized Stock (Ondo)
-- 0.00%

AAOION Applied Optoelectronics Tokenized Stock (Ondo)
-- 0.00%

PLON Planet Labs Tokenized Stock (Ondo)
-- 0.00%

HOME Defi App
-- 0.00%

$ARX Arcium
-- 0.00%

DELLON Dell Technologies Tokenized Stock (Ondo)
-- 0.00%

CBRSON Cerebras Systems Tokenized Stock (Ondo)
-- 0.00%