Rewards
Futures Daily Draw
100% Chance To Win With Daily Trades
現物の日次のドロー
Win 8,888 USDT In Grand Prizes
ステークして投票
投票してエアドロップを獲得
機関
プロなかつ専門的なサービス対応
BitMart VIP
限定報酬のロック解除
アカデミー
トレードとブロックチェーンについて
BitMart Internship
Start your Crypto Career Here
BitMart Travel
ワンストップグローバルトラベルサービス
モバイルチャージ
モバイルを簡単に、オンラインで、安全にチャージ
Send
Send money globally, fast and secure
BitMartモール
Live on crypto

Peezy 0x69 (PEEZY)
$ 0.00000041 (PEEZY/USD)
-3.91%
24H
Peezy 0x69 ライブ価格データ
Peezy 0x69の今日の価格は$ 0.00000041 (PEEZY/USD)です。 時価総額$ 127.41K USD、 24時間取引量$ 3,049.41 USD、 24時間の価格変動-3.91%、 そして流通供給量305.65B PEEZY。
Peezy 0x69 PEEZY 価格履歴 USD
Peezy 0x69の今日、7日間、30日間、90日間の価格を追跡
期間
24H変動幅
24H変動率 (%)
本日
$ 0.000000016
-3.91%
7日
$ 0.000000052
-10.74%
30日
$ 0.00000023
-34.95%
90日
$ 0.000000035
-7.50%
PEEZYを今すぐ所有
BitMartでPEEZYを簡単に安全に売買できます。
Peezy 0x69 相場情報
$ 0.00000039 24H変動幅 $ 0.00000043
過去最高値
$ 0.00000094
過去最安値
$ 0.00000018
24H変動幅
-3.91%
24H取引高
$ 3,049.41
供給量
305.65B
PEEZY
時価総額
$ 127.41K
最大供給量
420.69B
PEEZY
完全希薄化後時価総額
$ 175.36K
取引 PEEZY

Peezy 0x69 Xインサイト

davie satoshi
TA_Analyst
NFT_Expert
B
 27.3K @NFTdavie
 強気
PEEZY technical analysis shows two paths: bullish if support holds, bearish if it breaks.
davie satoshi
TA_Analyst
NFT_Expert
B
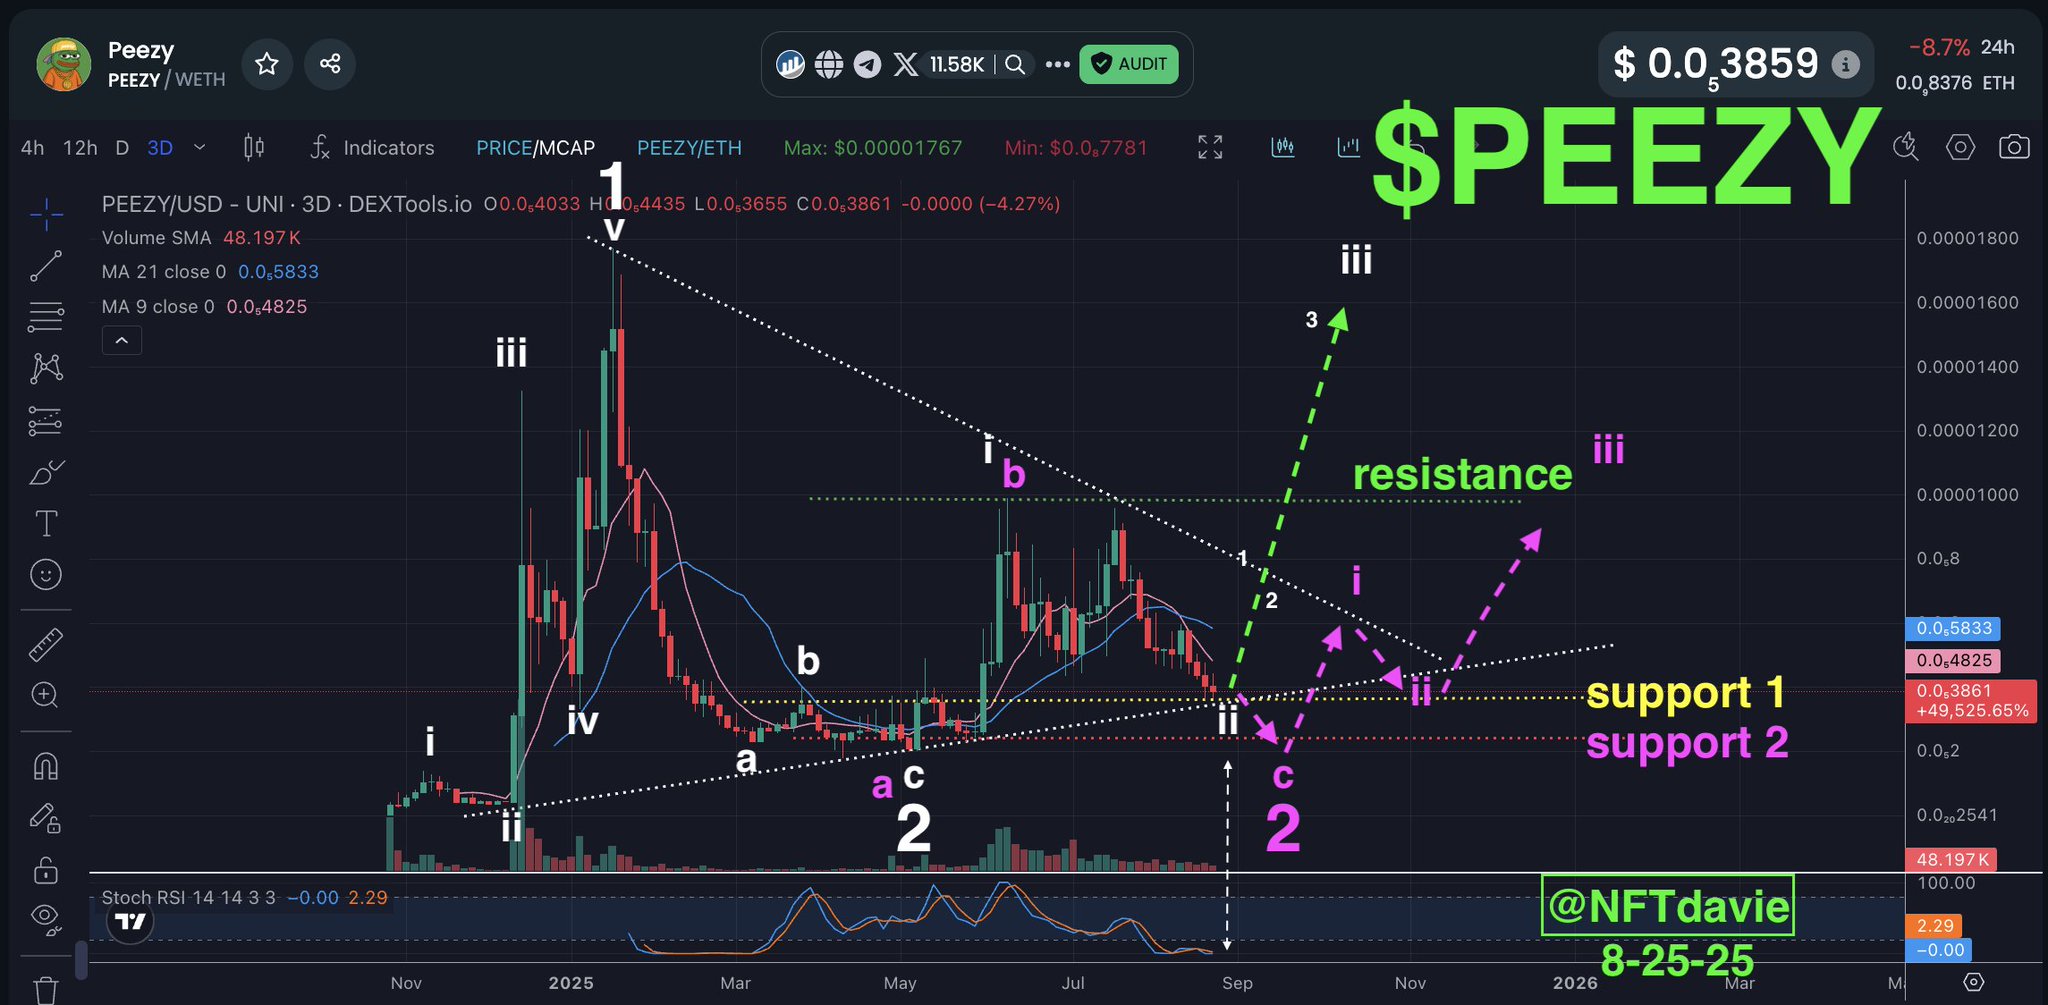
27.3K @NFTdavie Rapid Fire Charts: $PEEZY
PEEZY has many possible routes but here are the two likely routes IMO.
Bullish - GREEN/WHITE - In this scenario, major wave 2 has completed in spring of 2025 and the subsequent waves afterwards are part of major wave 3. We can make out a subwave i of 3 (labeled white i) and wave ii of 3 looks about complete (white ii where we are currently). There are two major support lines here (yellow/white) intersecting which should be strong. That should lead to a bounce here and the beginning of wave iii of 3.
Bearish - PINK - In this scenario, major wave 2 has not completed and $PEEZY is a laggard in the altcoin/memecoin trend. If it falls below the two intersecting support line (yellow and white), then it will fall onto the next one (pink). This does correspond better with the historic low stoch RSI reading on the 3 day chart as the low readings tend to correlate to major wave 2's. In this scenario, the climb back up begins with sub wave i and so forth. This scenario paints a picture of th
 42
42
 13
13
 2.8K
2.8K
2025-08-28 19:24
リリース後のPEEZYのトレンド
強気
PEEZY technical analysis shows two paths: bullish if support holds, bearish if it breaks.

Jools
Dev
Influencer
B
20.1K @jewelsindefi 強気
Predicting that ETH's rise will lead to buying interest for PEEZY.
When $ETH goes crazy, long standing communities like $PEEZY will eventually catch a bid.
Peezy money.
39
7
1.4K
2025-08-28 13:13
リリース後のPEEZYのトレンド
強気
Predicting that ETH's rise will lead to buying interest for PEEZY.
davie satoshi
TA_Analyst
NFT_Expert
B
27.3K @NFTdavie 中立
PEEZY technical analysis shows two paths: bullish if support holds, bearish if it breaks.
Rapid Fire Charts: $PEEZY
PEEZY has many possible routes but here are the two likely routes IMO.
Bullish - GREEN/WHITE - In this scenario, major wave 2 has completed in spring of 2025 and the subsequent waves afterwards are part of major wave 3. We can make out a subwave i of 3 (labeled white i) and wave ii of 3 looks about complete (white ii where we are currently). There are two major support lines here (yellow/white) intersecting which should be strong. That should lead to a bounce here and the beginning of wave iii of 3.
Bearish - PINK - In this scenario, major wave 2 has not completed and $PEEZY is a laggard in the altcoin/memecoin trend. If it falls below the two intersecting support line (yellow and white), then it will fall onto the next one (pink). This does correspond better with the historic low stoch RSI reading on the 3 day chart as the low readings tend to correlate to major wave 2's. In this scenario, the climb back up begins with sub wave i and so forth. This scenario paints a picture of th
42
13
2.8K
2025-08-25 16:15
リリース後のPEEZYのトレンド
中立
PEEZY technical analysis shows two paths: bullish if support holds, bearish if it breaks.
価格予測
PEEZYを購入するのに良い時期はいつですか?PEEZYは今買いでしょうか、売りでしょうか?
Peezy 0x69(PEEZY)を購入または売却する適切な時期を決定する際は、まずご自身の取引戦略とリスクプロファイルに合わせることが重要です。長期投資家と短期トレーダーは市場状況を異なる方法で解釈することが多いため、決定には個人的なアプローチを反映すべきです。 最新の PEEZY 4時間テクニカル分析によると、現在の取引シグナルは 購入 です。 最新のPEEZY1日テクニカル分析によると、現在のシグナルはホールドです。

ビーコン予測
の確率的価格予測(今後24時間)ビーコン予測に関する免責事項
このページに表示されるデータ結果は、選択した取引ペアの実際の取引データ(OHLCV)と対応するテクニカル指標に基づいて分析されています。
この予測は実験的な技術的成果であり、あくまで参考目的で提供しています。これは投資アドバイスをではありません。現実世界での予期せぬ出来事が市場行動に大きな影響を与える可能性があります。トレーダーは慎重に意思決定を行うべきです。
この予測は実験的な技術的成果であり、あくまで参考目的で提供しています。これは投資アドバイスをではありません。現実世界での予期せぬ出来事が市場行動に大きな影響を与える可能性があります。トレーダーは慎重に意思決定を行うべきです。
アプリバージョン Peezy 0x69
Peezy 0x69 (PEEZY) is a cryptocurrency launched in 2024and operates on the Ethereum platform. Peezy 0x69 has a current supply of 359,709,061,786 with 305,650,329,936 in circulation. The last known price of Peezy 0x69 is 0.00000046 USD and is down -0.35 over the last 24 hours. It is currently trading on 10 active market(s) with $3,606.92 traded over the last 24 hours. More information can be found at https://peezy.vip/.
続きを読む
さらに詳しく
BM Discovery


新規上場

NES Nesa
-- 0.00%

HIVEON HIVE Digital Technologies
-- 0.00%

SOXSON Direxion Daily Semi Bear 3X ETF
-- 0.00%

TON AT&T Tokenized Stock (Ondo)
-- 0.00%

KEELON Keel Infrastructure
-- 0.00%

DRAMON Roundhill Memory ETF
-- 0.00%

JAM JAM Coin
-- 0.00%

UMXM Manadia
-- 0.00%

UMCON United Microelectronics Tokenized Stock (Ondo)
-- 0.00%

AMKRON Amkor Technology Tokenized Stock (Ondo)
-- 0.00%