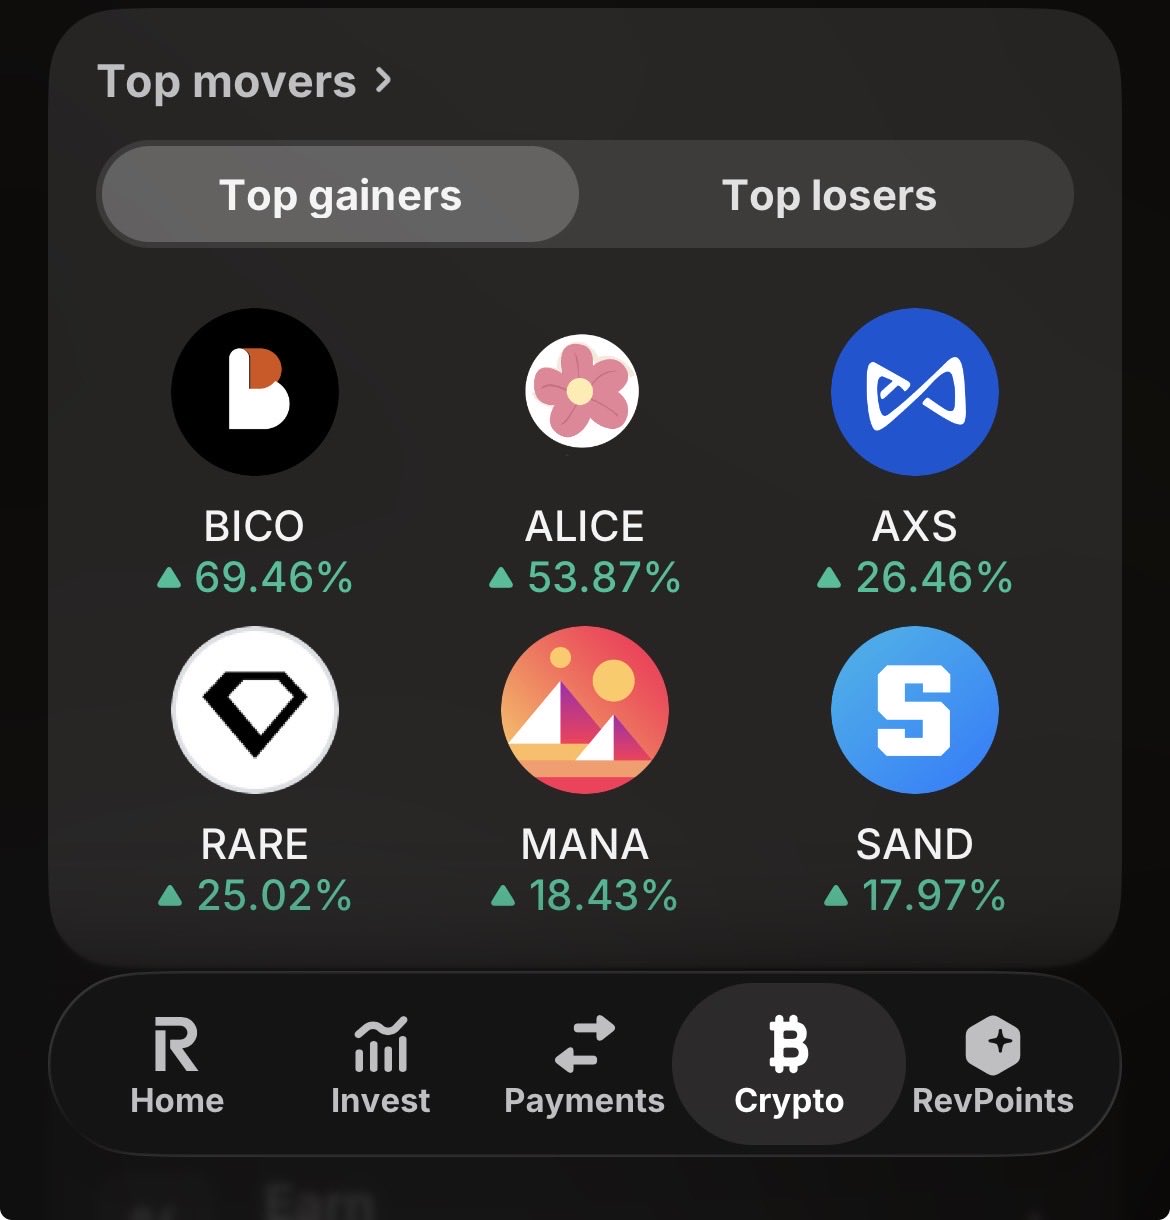
Ehhh guys, has it began for the gaming tokens ? https://t.co/lpxoE49gcL


 3.6K @Incainvests
 Ehhh guys, has it began for the gaming tokens ? https://t.co/lpxoE49gcL
3.6K @Incainvests I think its highly probable that GTA-6 (due to launch in November) may spark renewed interest in Blockchain Gaming projects, there is rumour of them integrating Crypto rewards or in-game currency like $RSTAR or potential payouts in $BTC
This is purely speculation, but I think its time I began some research into Crypto gaming projects who are still actively building and delivering.
Gotta try and stay ahead of the narratives folks, and lets be honest these particular cryptos have been beaten to a pulp, there has gotta be some good deals out there.
Drop any you think may do well below, preferably they are 👇
Actively shipping Code
Have large engagement / communities
Remained active on Socials during the bear market
Tied to Gaming / NFT'S
Looking into the usuals for the time being $SAND $GALA $IMX $RON $MANA
I will report back with my top pick over the coming weeks 🤝
 1
1
 0
0
 67
67
 4.2K @GreatZodd
  798 @hidden_cosoo
 The most important condition for a moonshot coin is the “retail investors”.
There are many who say that if retail investors are present it won’t go up…
But ultimately the one you have to accept is also the retail investors.
Coins that lack factors that would attract retail investors can’t go up.
Now everyone has been caught too much (?) there must be a reason to invest.
For example, look at the previous coin‑market superstar Sandbox.
“Metaverse is the future (technology theme)”
“SoftBank invested (institutional investment)”
Then it hit ten thousand and the chart completed a Burj Khalifa.
What about this year?
The technology‑theme candidates are clear: AI, RWA, space (probably not).
Institutional investment comes from AI/finance giants or nation/international bodies. If not large‑scale, you can’t interact.
Put weight on projects where this combination can happen.
Mid‑size will go up.
37
4
2.8K
 83.5K @realdanielnita
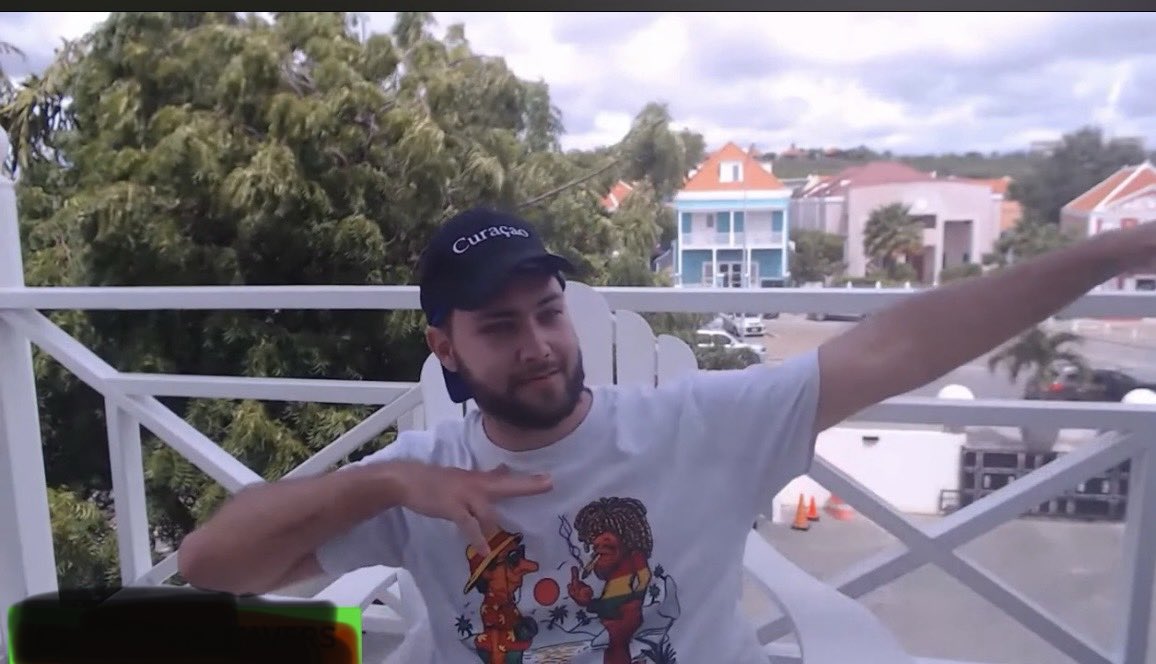
 Yesterday Curacao took a 7:1 beating from Germany. I was in Curacao in 2021 and remember it fondly because it was a crypto bull market, SAND went from 10 cents to $10 and the metaverse was in the planning stage with NFT-urile, ETH rose from $100 to $4,500 and Bitcoin jumped from $3,800 to $60,000 while I had no white horse in my head😂.
Fun fact: The Curacao guilder was once a global reserve currency like the dollar between 1609 and 1720, why? Because it was actually the Netherlands’s currency. Curacao is a former Dutch colony and even today is under the Dutch kingdom. The Netherlands switched to the euro but in Curacao you can still find the old money. Curacao has scored more World Cup goals than Romania in the past almost 30 years😂
 129
3
5.5K
129
3
5.5K