口座開設
QRコードでアプリをダウンロードする
iOS & Android

VAIOT (VAI)

$
$ 1.62 (VAI/USD)
-0.32%
24H
1時間24時間週足月足1年最大
How Do You Feel About VAI? today?
強気 0
弱気 0
強気
弱気
強気 0
弱気 0
Note: This information is for reference only.

VAIOT ライブ価格データ

Today's price of VAIOT Is $ 1.62 (VAI/USD). With A Market Cap Of $ 643.33M USD. 24-Hour Trading Volume Of $ 316.10 USD, A 24-Hour Price Change Of -0.75%, And A Circulating Supply Of 396.60M VAI.

VAIOT VAI Price History USD

Track the price of VAIOT for today, 7 days, 30 days and 90 days
期間
24H変動幅
24H変動率 (%)
本日
0
-0.32%
7日
--
--
30日
--
--
90日
0
-20.68%

Own VAI Now

Buy and sell VAI easily and securely on BitMart.
Buy/Sell VAI Now
Buy/Sell {0} Now
VAIOT 相場情報
最終取引価格 $ 1.62
$ 1.57 24H変動幅 $ 1.63
過去最高値
‎$ 3.22‎
過去最安値
‎$ 0.10‎
24H変動幅
‎-0.75%‎
24H取引高
‎$ 316.10‎
供給量
250.00M VAI
時価総額
‎$ 405.53M‎
最大供給量
250.00M VAI
完全希薄化後時価総額
‎$ 405.53M‎

稼ぐ

眠っている暗号資産を活用し、セービングやステーキングで安定収益を獲得。
今すぐ試す
今すぐ試す

VAIOT Xインサイト

avatar
VAI has reached a potential reversal zone; if it holds above $0.00465, a rebound breaking the descending trendline is expected.

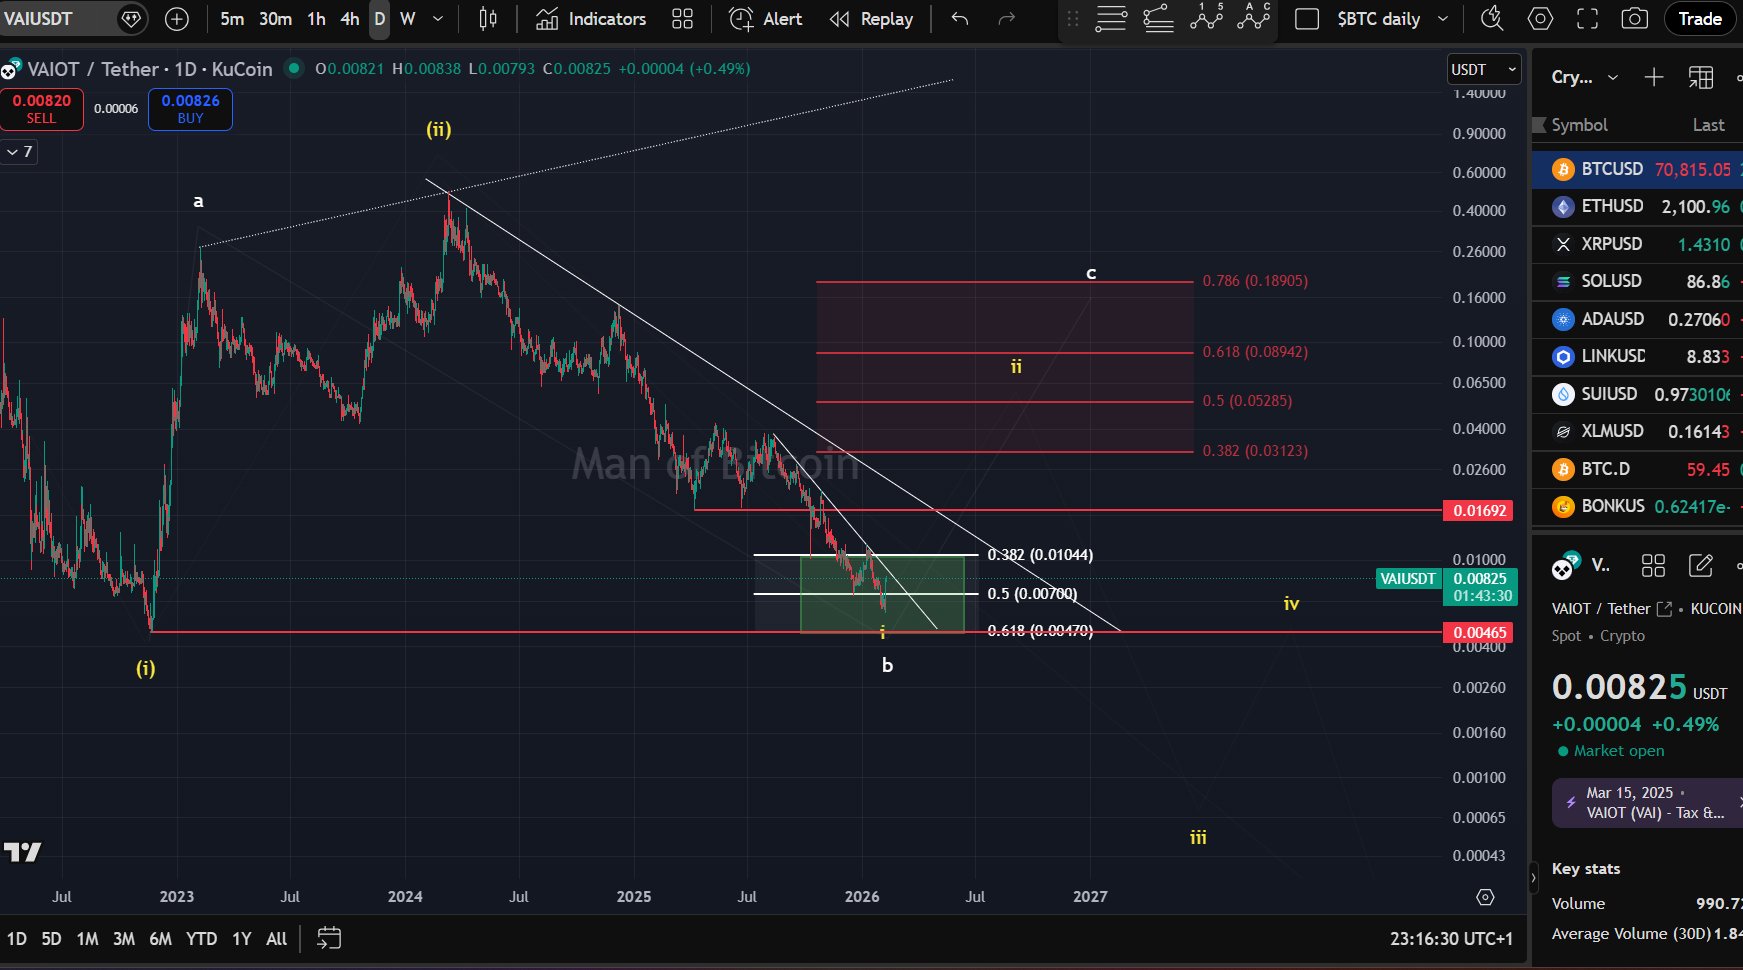
$VAI (request): The chart remains in a clear downtrend and has reached my target zone for a potential reversal.
As long as price holds above $0.00465, a rally toward the red resistance zone remains likely.
A break above the descending trendline would signal an early sign of reversal.

view 11
view 2
view 1.1K
1 日 前
リリース後のVAIのトレンド
データなし
強気
VAI has reached a potential reversal zone; if it holds above $0.00465, a rebound breaking the descending trendline is expected.
avatar
If VAI holds the $0.01692 support, it is expected to rise along the yellow path of technical analysis, with higher price targets.

$VAI (request): As long as the price holds above $0.01692, the yellow path remains my preferred roadmap. https://t.co/oB2lSbxNhy

view 4
view 1
view 939
149 日 前
リリース後のVAIのトレンド
データなし
非常に強気
If VAI holds the $0.01692 support, it is expected to rise along the yellow path of technical analysis, with higher price targets.
avatar
VAI price faces a critical point; a break above $0.04195 is bullish, while a break below $0.01692 could target the green zone.

$VAI (by request): Bulls need to push the price above $0.04195 to confirm that at least the yellow scenario is unfolding to the upside.
Key support is at $0.01692; a sustained break below this level could target the green zone. https://t.co/F7ETLXibw0

view 9
view 2
view 928
151 日 前
リリース後のVAIのトレンド
データなし
強気
VAI price faces a critical point; a break above $0.04195 is bullish, while a break below $0.01692 could target the green zone.
詳細確認

価格予測

When is a good time to buy VAI? Should I buy or sell VAI now?

When deciding whether it’s a good time to buy or sell VAIOT (VAI), it’s important to first align with your own trading strategy and risk profile.Long-term investors and short-term traders often interpret market conditions differently, so your decision should reflect your personal approach. According to the latest VAI 4-hour technical analysis, the current trading signal is Hold. According to the latest VAI 1-day technical analysis, the current signal is Hold.
52
Hold
4-hour technical analysis of VAI
Last Update 2026-02-10 09:35:37
47
Hold
1-day technical analysis of VAI
Last Update 2026-02-10 09:35:37
beacon

ビーコン予測

Probabilistic Price Forecast (Next 24 Hours)
crypto.loading
アプリバージョン VAIOT
VAIOT (VAI) is a cryptocurrency launched in 2021and operates on the Ethereum platform. VAIOT has a current supply of 400,000,000 with 396,600,000 in circulation. The last known price of VAIOT is 0.00810086 USD and is down -0.80 over the last 24 hours. It is currently trading on 37 active market(s) with $89,890.73 traded over the last 24 hours. More information can be found at https://www.vaiot.ai/.
続きを読む