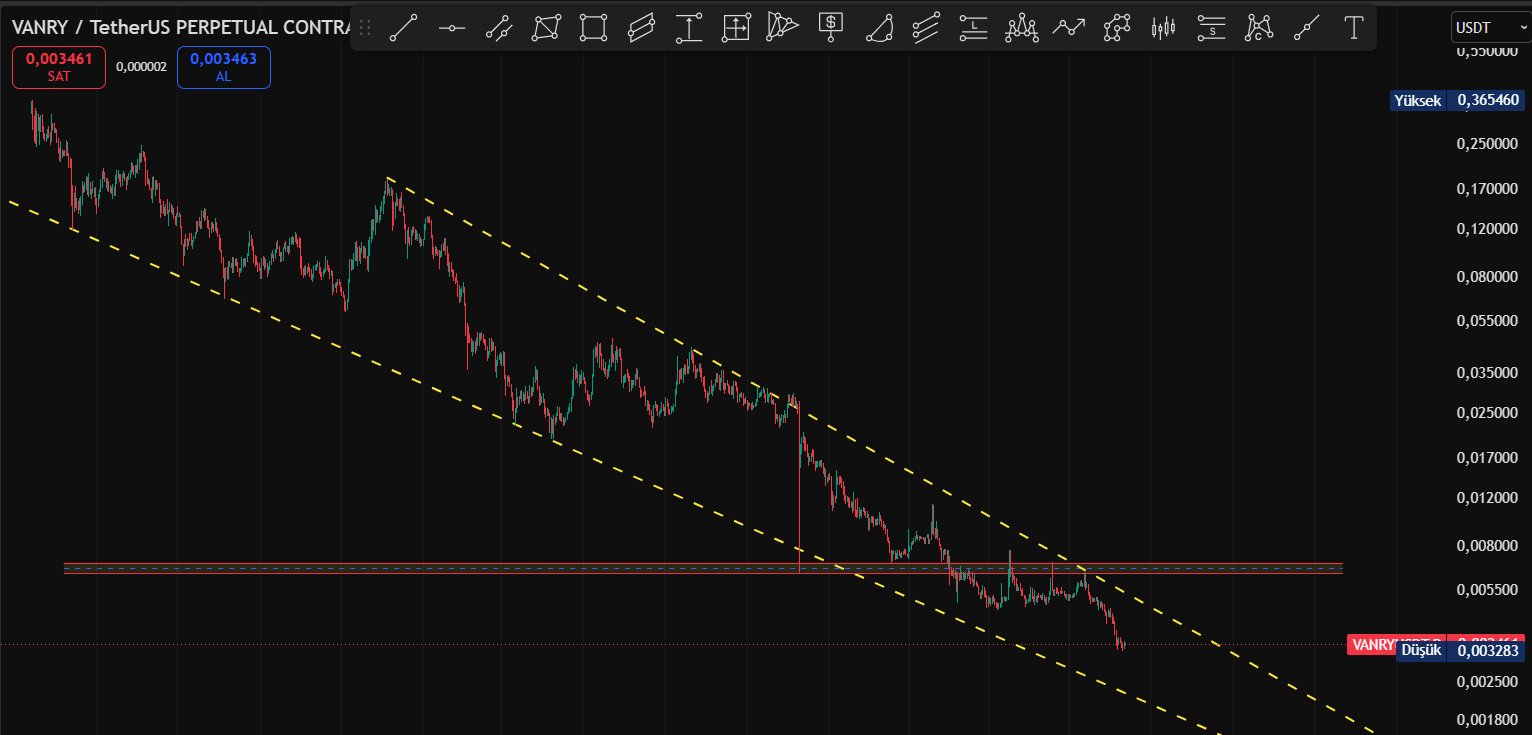
#VANRY the downtrend continues.
I will be watching for a while longer. https://t.co/KoH6X3auF6


 27.8K @Cyriptoman4
 #VANRY the downtrend continues.
I will be watching for a while longer. https://t.co/KoH6X3auF6
 78
78
 1
1
 1.6K
1.6K
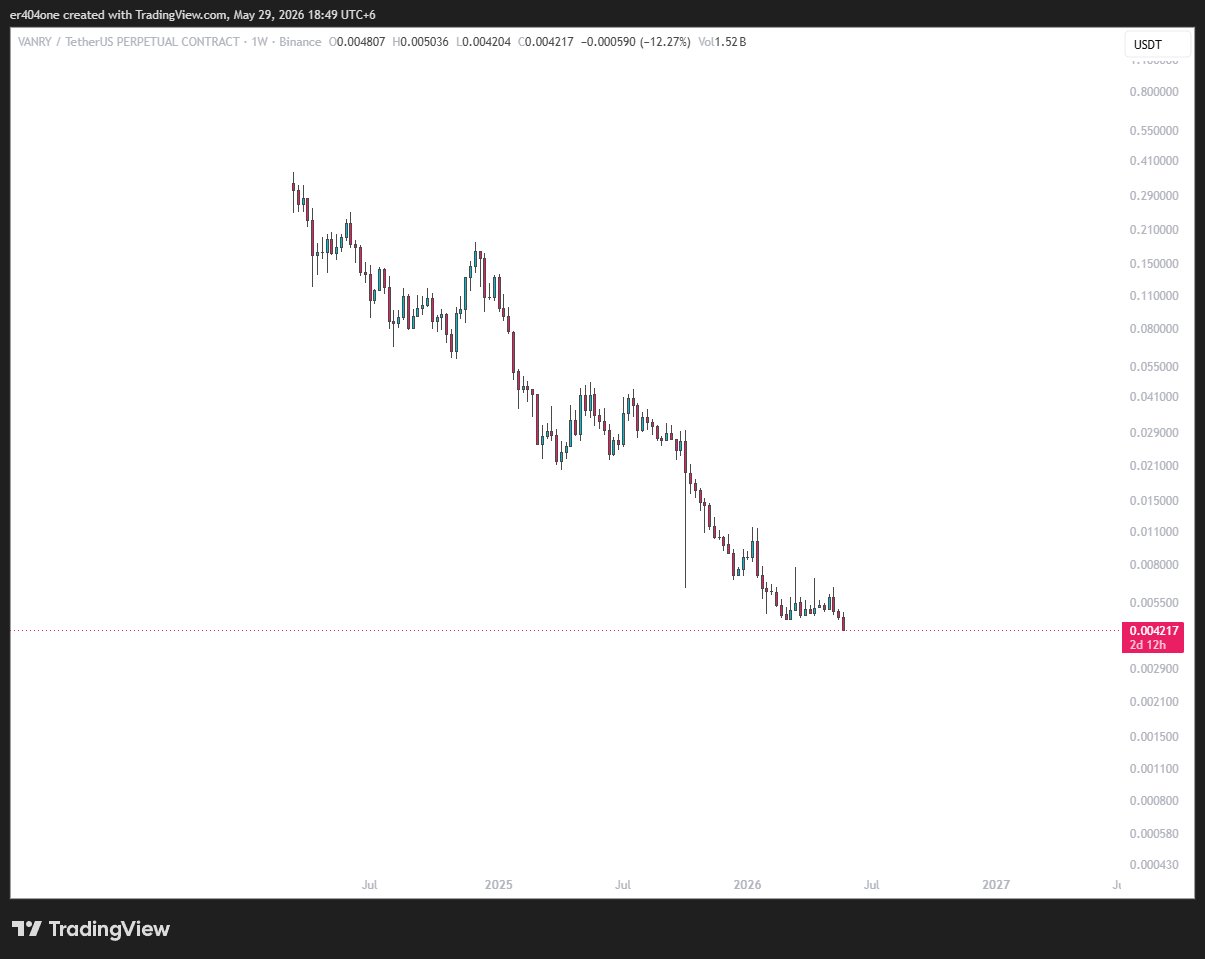
 11.2K @ER404i
 So many CTs shilled this scam. Now, ask them why it's down like this? $Vanry https://t.co/e3NFr52pE5
 32
2
2.6K
32
2
2.6K
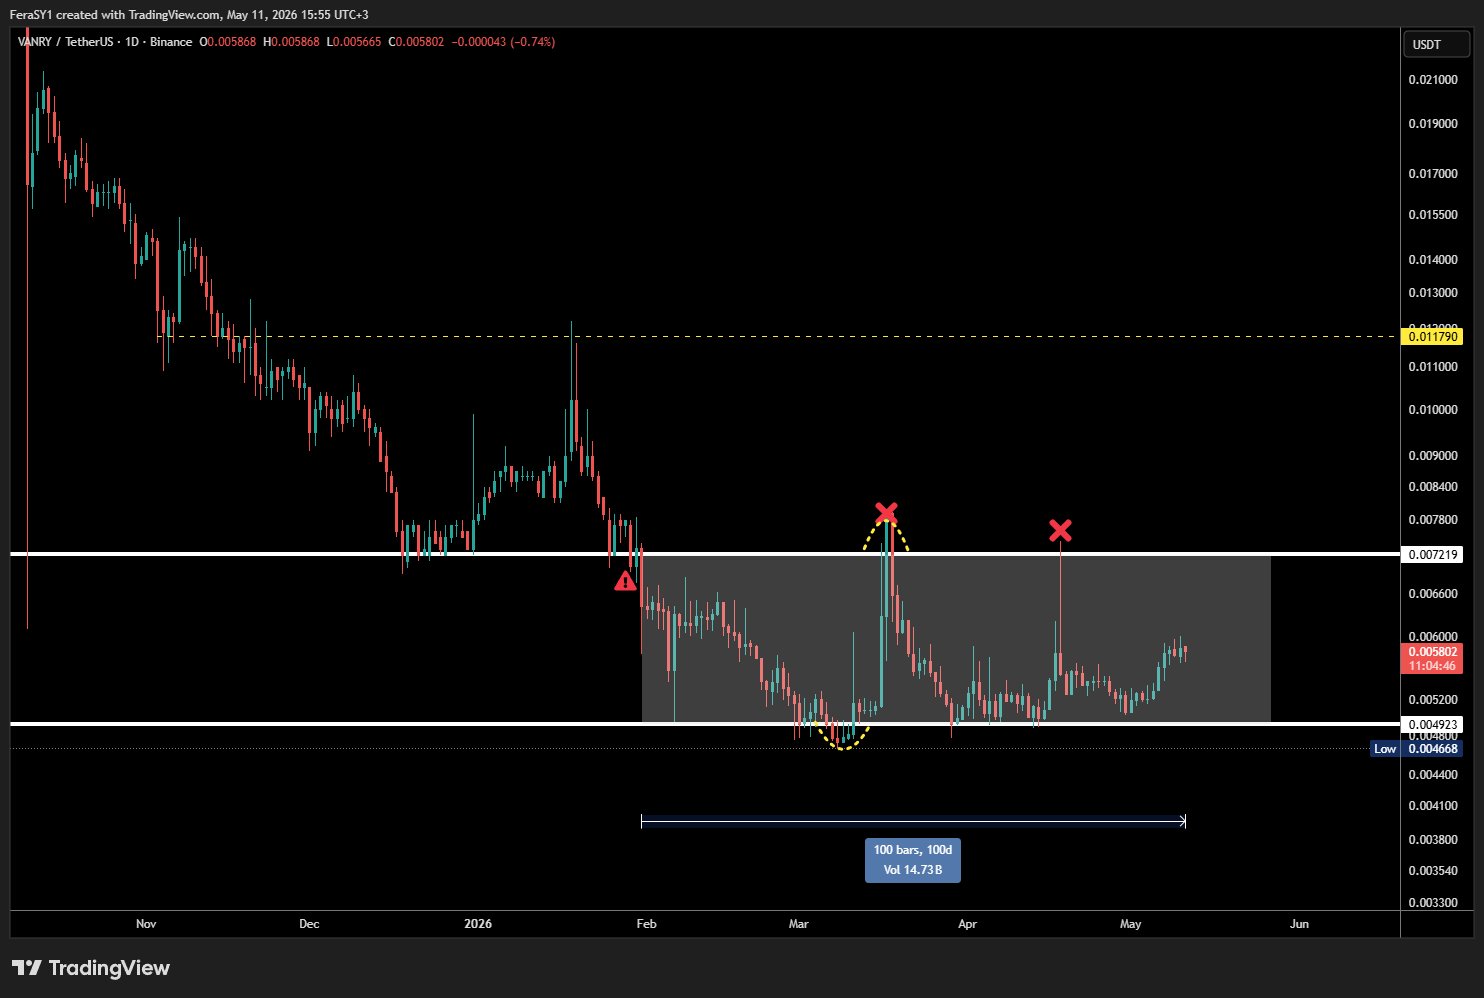
 92.5K @CryptoFeras
 $VANRY #VANRY
One of the worst looking charts on high time frames.
been ranging between 0.0049-0.0072 for a 100 days
a reversal can ONLY be considered if it flips 0.0072 successfully
till then, range dynamics in play.
#trading https://t.co/x6SHYOakNN
 132 @GJB41093952
 @CryptoFeras $ZIG and $VANRY please
22
2
3.8K